Your service has a 4 GiB maximum heap and a 5 GiB container memory limit. The heap dashboard looks comfortable, yet the container is killed for running out of memory. Has the JVM ignored its heap setting?
In Lesson 1, we separated execution, memory, and runtime services. Now we’ll zoom into memory. The distinction that explains this incident is JVM process memory ≠ Java heap. The heap setting controls one region inside a larger process; understanding the other regions tells you where to investigate.
Start with the process boundary
A running HotSpot JVM needs somewhere to store objects, track method calls, describe classes, and keep generated machine code. Each job has its own memory needs. The map below groups those responsibilities inside one process. Native memory is a broad category here: Metaspace and the Code Cache are themselves native memory.
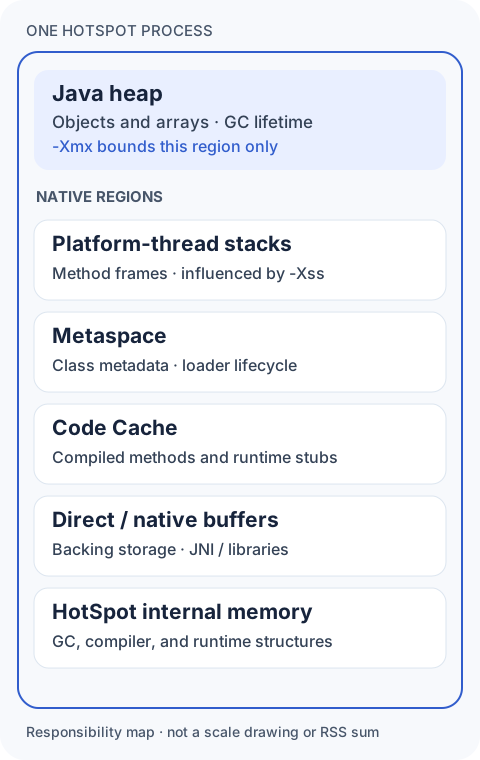
Reserved, committed, and resident memory
JVM tools and operating-system tools describe memory in different ways. Let’s use one illustrative example to see what their numbers mean.
Suppose the JVM reserves 1 GB of virtual address space for a memory region. Reserved means that this address space is set aside for possible use. Think of it as asking, “Keep this range available in case I need it.” It does not mean the JVM has already consumed 1 GB of physical RAM.
Now suppose the JVM commits 300 MB within that reservation. Committed means memory that the JVM has made usable. The region still has 1 GB reserved, but only 300 MB has been made available for use so far. Making memory usable does not mean all of it is currently in RAM.
Of those 300 MB, suppose 180 MB is currently backed by physical RAM. That is the resident portion. For this example, the relationship looks like this:
Reserved: 1 GB
└── Committed: 300 MB
    └── Resident: 180 MB
The operating system reports RSS (Resident Set Size): the amount of a process’s memory currently resident in physical RAM. Process RSS covers the whole JVM process, including memory outside the Java heap; it is not the same measurement as committed heap memory.
For example, these illustrative readings can both be correct:
JVM: Reserved heap = 4 GB
OS:  Process RSS   = 1.8 GB
The JVM has set aside 4 GB of address space for the heap, without needing all 4 GB to be in RAM. The whole process currently has 1.8 GB resident across the heap and its other regions. There is no contradiction: the two numbers measure different things.
A large reservation alone does not prove physical memory pressure. Likewise, a heap-usage chart tells you about the Java heap, not the resident footprint of the whole process.
The heap holds Java objects
Consider a request handler that creates a customer:
Customer customer = new Customer();Conceptually, the object lives on the Java heap, shared by the application’s threads. HotSpot may optimize some allocations away, as we noted in Lesson 1. For objects that are allocated, garbage collection manages their heap lifetime and can reclaim space when they are no longer reachable.
-Xmx4g sets a maximum heap size of 4 GiB. It does not mean that 4 GiB of objects exist, that all of that heap is resident, or that the entire process must fit within 4 GiB. Heap usage, committed heap, and maximum heap answer different questions.
The request handler needs more than its Customer object to execute. Following that request takes us into the other regions.
Platform threads need stacks
When a platform thread calls the handler, its stack supports method frames: local working state, operand state, and information needed to return to callers. In HotSpot, platform threads use native stacks; -Xss influences their stack size. Actual frame representation depends on interpretation, compilation, and the platform.
Suppose you have 1,000 platform threads with a nominal 1 MiB stack each. That suggests roughly 1 GiB of stack reservation, before implementation details such as rounding and guard areas. It does not establish 1 GiB of RSS. How much becomes resident depends on stack use and OS behavior. More threads still create more potential memory demand, even if heap occupancy stays flat.
This arithmetic is specifically about platform threads. Virtual threads do not each reserve a matching native stack: their stack chunks live on the heap, and they execute on carrier platform threads that have native stacks. We’ll return to that distinction when we study threads.
More threads, unchanged heap: what can you conclude?
Stack reservation may have increased, and resident stack memory may also increase as those threads do work. You cannot calculate the RSS increase from thread count multiplied by -Xss alone. Compare thread counts and stack accounting with OS measurements.
Metaspace follows loaded classes
The Customer object and the description of the Customer class are different things. HotSpot stores much of its class metadata in native Metaspace: structures describing methods, fields, and runtime class information. Java’s heap-resident Class object is not the entirety of that metadata. Metaspace replaced PermGen in HotSpot in Java 8.
Growth therefore follows loaded classes and their class loaders, rather than just the number of customer objects. Frameworks that generate classes or applications that repeatedly reload plugins can make this visible.
Imagine a plugin is replaced, but a long-lived registry still holds its old class loader. That reference can keep the loader reachable, preventing its classes from becoming eligible for unloading. Their metadata remains needed even after the plugin has stopped handling requests. Removing the reference can make unloading possible; it does not promise immediate unloading or an immediate RSS drop. Reclamation depends on runtime behavior, and returning unused native memory to the OS is another step.
This is why a Metaspace investigation follows class counts and class-loader reachability. Increasing the Java heap does not remove the retained loader.
The Code Cache holds generated code
Our handler may start out interpreted and later become hot enough for JIT compilation. The resulting native machine code needs executable memory. HotSpot keeps compiled methods and other generated code, such as runtime stubs, in its Code Cache.
The same method can therefore involve bytecode and metadata as well as compiled machine code. Those are different representations with different jobs. Code Cache growth during warmup can be expected as more methods compile; it isn’t evidence that more application objects are being retained. Code Cache capacity and compilation activity deserve their own measurements.
Direct buffers put backing storage outside the heap
Now suppose the handler works with a direct buffer for I/O:
ByteBuffer buffer = ByteBuffer.allocateDirect(1024 * 1024);The Java buffer object is on the heap, while a direct buffer’s backing storage is outside the ordinary garbage-collected heap. The example requests 1 MiB of buffer capacity, not a 1 MiB Java byte array. Direct buffers can help avoid intermediate copying in native I/O, although this is a best-effort capability rather than a universal zero-copy guarantee.
A heap graph can therefore retain a comparatively small wrapper that keeps a much larger native allocation alive. Heap occupancy may look stable while buffer pools and RSS grow. Cleanup can be connected to Java reachability, but that does not turn backing storage into heap memory or guarantee prompt release. Libraries may also pool and explicitly manage native resources.
JNI code and native libraries add further allocations with their own ownership rules. Direct-buffer statistics are useful evidence for NIO buffers; they are not a census of every native library allocation.
HotSpot also needs memory to do its work
Garbage collectors need bookkeeping structures, JIT compilers need working memory, and the runtime needs internal tables and synchronization structures. These consume native memory beyond the regions already discussed. Their size depends on the collector, JDK, workload, and configuration; there is no universal fixed overhead to add to every heap.
Keep the boundary precise: GC manages Java heap object lifetime, rather than total process memory. It can participate in related cleanup, including class unloading and reachability-triggered resource cleanup. But it is not a general owner of every native allocation, and reclaiming an object does not imply the process immediately returns the same number of bytes to the OS.
Leave room around the heap in containers
Return to the service with a 5 GiB container limit and -Xmx4g. If the heap eventually contributes close to 4 GiB of resident memory and everything else contributes another 1.3 GiB, the process alone could be around 5.3 GiB. This is an illustrative budget, not measured output or a prediction from -Xmx. It assumes resident contributions, not a sum of reservations and limits.
On Linux, Kubernetes memory limits are enforced through cgroups. The kernel can OOM-kill a process when the applicable memory limit is exceeded under pressure. Container accounting is broader than a single JVM’s RSS: other charged memory, including file cache and memory-backed volumes, can matter. A container OOM kill is also different from a Java OutOfMemoryError; you may receive no Java heap dump from the kill.
Choose heap size with headroom for the rest of the workload. Measure startup, warmup, peak traffic, thread counts, buffer pools, and class loading. There is no safe percentage for every service. A comfortable heap chart tells you about the heap, not whether the container has enough headroom.
The container is killed while heap usage is stable. What comes next?
Check the termination reason and container memory metrics, then compare process RSS with heap, thread, class, and buffer trends. Native growth is one possibility; other memory charged to the container is another. A heap dump alone cannot explain all of them, and raising -Xmx may reduce the headroom further.
Match the evidence to the region
Ask which region is growing before choosing a tool. These are starting points for an investigation, not one-to-one proofs of a leak.
| Suspected region | Useful first evidence |
|---|---|
| Java heap | GC logs and post-GC occupancy; histogram or heap dump for retained objects |
| Metaspace | Loaded/unloaded class counts, class-loader statistics, loader retention paths |
| Platform-thread stacks | Platform-thread counts, thread dumps, stack settings, native stack accounting |
| Code Cache | Code Cache usage and compiler activity |
| Direct/native buffers | NIO BufferPool metrics, library pool metrics, allocation ownership |
| HotSpot internal native memory | Native Memory Tracking categories and changes over time |
| Unexplained process/container growth | OS memory maps, container accounting, native allocation tools |
For HotSpot, Native Memory Tracking (NMT) provides a useful view of internal allocations. Enable it when starting a disposable local application with -XX:NativeMemoryTracking=summary. It is off by default, adds overhead, and cannot be started later with jcmd.
With NMT enabled, replace <pid> with that JVM’s process ID and run:
jcmd <pid> VM.native_memory summaryRead reserved and committed columns separately. Categories such as Java Heap, Class, Thread, Code, GC, and Compiler help locate changes; they are not an RSS breakdown. Establish a baseline to compare later activity:
jcmd <pid> VM.native_memory baseline
# After the workload has run:
jcmd <pid> VM.native_memory summary.diff
NMT is HotSpot-focused, not a complete profiler for every native allocation. Third-party native code and some JDK library allocations can lie outside its tracking. A flat report does not rule out native growth; compare it with OS and application measurements. These commands introduce the workflow; a full leak investigation belongs in a later lesson.
Zoom into one object next
You now have two boundaries to keep separate: the Java heap inside the JVM process, and the process inside its container’s memory accounting. When the numbers disagree, identify what each measurement includes before changing a setting.
Lesson 3, “Object layout inside the heap”, is our next step: looking inside a heap object at its header, mark word, class pointer, and alignment. That will explain why the space occupied by an object can exceed the sizes of its fields.
Sources and further reading
- JVM specification: heap, stacks, and frames
- Java launcher: heap, stack, and tracking options
- HotSpot: class metadata and native memory
- JEP 444: virtual-thread stacks and carriers
- HotSpot: tiered compilation and the Code Cache
- ByteBuffer: direct buffers and allocation behavior
- Native Memory Tracking: setup, reports, and coverage limits
- Kubernetes: memory limits and container accounting