You create a Customer for each incoming request. With many requests running at once, many threads create objects at once. Does every new Customer() have to ask the operating system for memory, or wait for the other threads to finish allocating?
Lesson 7 followed the reference writes that help GC find live objects. Now we move one step earlier: before an object can join that graph, the JVM needs somewhere to put it.
For an ordinary small object in HotSpot, obtaining that space is often cheap. The common path checks a boundary, advances a pointer, and initializes object memory. A Thread-Local Allocation Buffer, or TLAB, makes that path scale across allocating threads.
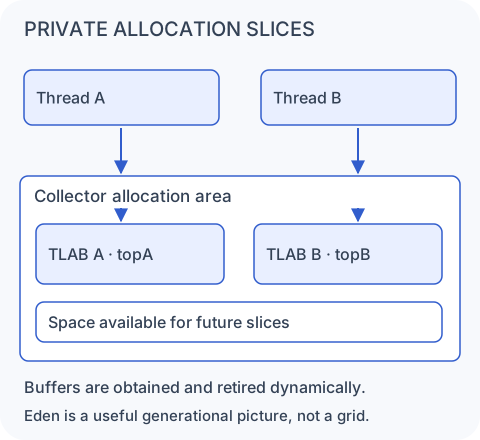
Follow each thread down to its buffer. The important boundary is around the allocation operation: each thread advances its own pointer. The objects created inside those boundaries are still ordinary heap objects.
Start with the contention problem
Imagine a hypothetical heap allocator with just one shared top pointer. Thread A wants space for a Customer while Thread B wants space for an Order. If both read the same pointer and independently advance it, they could claim overlapping memory. The allocator must coordinate their updates.
Putting a lock around every allocation would make threads wait at one very busy location. An atomic update can avoid that particular lock, but many cores still compete to update shared state. This is a thought experiment explaining the problem, not a claim that HotSpot normally takes a global lock for every object.
A TLAB moves that coordination away from most individual allocations. HotSpot obtains a slice of allocation space for an execution thread, which then allocates independently inside it. Other allocating threads use their own slices.
In a traditional generational picture, you can imagine these slices coming from Eden. They are dynamically obtained thread-private allocation slices, not permanent Eden partitions. The collector controls the backing allocation area; G1, for example, manages young allocation through regions. TLAB size, refill policy, and backing layout are implementation choices, not Java language guarantees.
Inside the TLAB, allocation becomes local
A simplified TLAB has three positions: start, the beginning of the buffer; top, the next available address; and end, the allocation limit. Space before top has already been consumed. Space after it remains available.
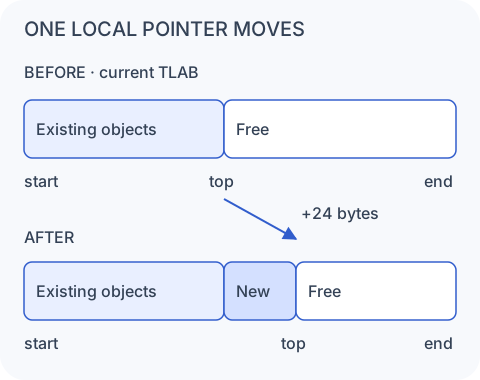
The second row differs from the first by one object. There is no search through holes: the free space is contiguous, so the allocator can take the next portion directly. This is the bump-pointer idea from the reclamation lesson, now applied to a thread-private pointer.
The following is conceptual pseudocode, not executable allocator code. It assumes a known, aligned size and leaves out overflow handling and runtime instrumentation:
newTop = top + objectSize
if newTop <= end:
    objectAddress = top
    top = newTop
    initialize object at objectAddress
else:
    enter slower allocation machinery
Thread A changes topA; Thread B changes topB. Neither needs to coordinate with the other thread for this ordinary local reservation. That removes a frequent source of contention, although it does not remove memory writes, cache effects, or the eventual cost of collection.
Allocation and constructor execution are different work
Consider the expression again:
Customer customer = new Customer();Obtaining storage is only part of what happens. HotSpot needs a correctly sized object with an appropriate header and Java’s required initial field values, such as zero and null. Constructor initialization then performs the program’s work. A constructor might allocate more objects, validate input, or do an expensive computation.
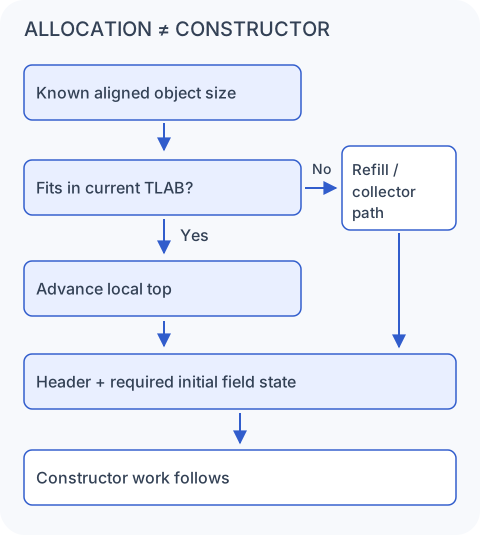
The fit check has two exits. Success stays on the local path; failure enters refill or collector allocation machinery. In either case, successfully obtaining memory does not mean the constructor’s work has already happened.
For example, new Customer(expensiveDatabaseLookup()) includes argument evaluation and construction work as well as storage allocation. Timing the whole expression does not isolate the allocator. Our fast-path model assumes the class is ready for allocation; class initialization and optimization can also change the work you observe.
HotSpot does not normally call a general-purpose native allocator such as malloc() for each small Java object. It already manages the heap space. Initialization still has a cost, especially for large arrays, but zeroing may happen in bulk or be optimized. The diagram describes required effects rather than insisting on one instruction sequence.
Eventually the buffer needs replenishing
Suppose the next object needs 64 bytes, but only 24 bytes remain. Those illustrative sizes make the boundary failure visible: the new object cannot fit even though the TLAB is not completely full.
One possible outcome is to retire the current TLAB, obtain a new slice from the collector’s allocation area, and resume local allocation. Retiring a buffer ends its use for allocations; it does not reclaim the objects already placed there. Their lifetime still follows reachability and GC.
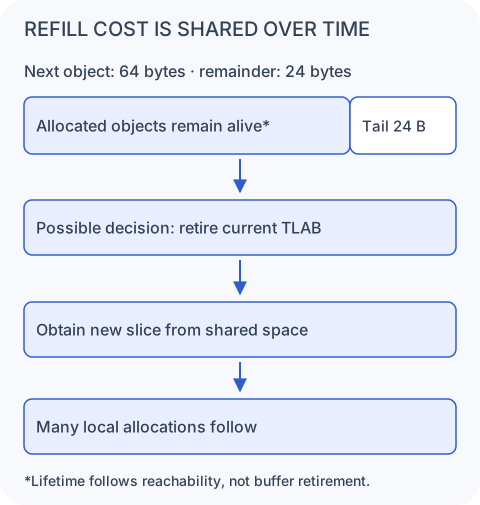
Refilling needs shared allocation machinery, so it involves more work than advancing an existing local pointer. But one refill can support many subsequent objects. Its cost is amortized: spread over the allocations that use the buffer, rather than paid in full for every object.
The unused tail explains a trade-off. Immediately abandoning every remainder would waste space. Keeping a useful remainder and allocating the current object elsewhere can avoid that waste. HotSpot therefore does not have to retire the TLAB on every failed fit check. We do not need its refill algorithms here; we need the intuition that local speed, refill frequency, and unused capacity must be balanced.
Some allocations go outside the TLAB
A large array, such as new byte[20_000_000], is unlikely to fit the picture of a small ordinary allocation in a private buffer. An unsuitable allocation can take an outside-TLAB path, including when HotSpot retains the current buffer for later smaller objects.
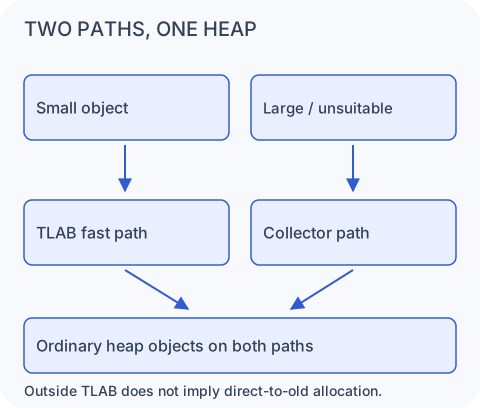
The distinction is about how space is obtained. It does not say that outside-TLAB allocation is catastrophically expensive, or that every such object goes directly to old memory. The collector may have efficient shared allocation mechanisms and special policies for large objects. Under memory pressure, an allocation may also need more substantial work, including collection.
There is no universal Java threshold dividing the two paths. Size, available buffer space, collector policy, and runtime settings matter. An outside-TLAB event is a useful diagnostic clue, not a performance verdict by itself.
Thread-local allocation does not make an object thread-owned
Thread A can allocate Customer X in its TLAB and later pass a reference to Thread B. Both threads can then use the same ordinary heap object. The usual Java rules for safe publication and synchronization still apply; TLAB allocation adds no special sharing guarantee.
This differs from ThreadLocal<Customer>. A TLAB optimizes where an execution thread obtains object storage. ThreadLocal<T> associates Java values with threads. Even a value stored through ThreadLocal is not magically prevented from being referenced elsewhere.
The useful distinction is private allocation state, shared heap objects. Retiring a buffer or moving execution to another thread does not invalidate the objects that were allocated there.
Virtual threads use the carrier’s allocation machinery
Now suppose the application creates a million virtual threads. That does not require a million permanent TLABs. A virtual thread executes Java code while mounted on a carrier platform thread. HotSpot’s low-level TLAB state belongs to the underlying execution thread, so allocations while mounted use that carrier’s allocation machinery.
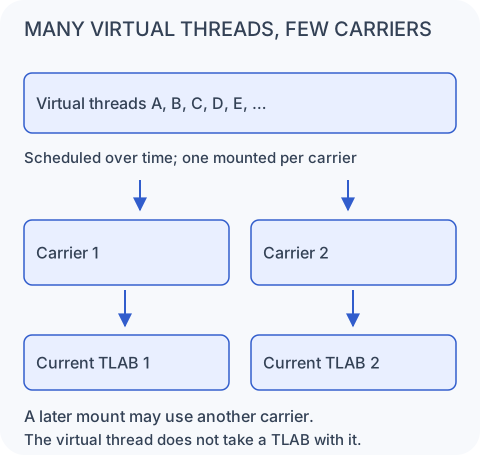
Read the picture as a scheduling relationship, not simultaneous execution of several virtual threads on one carrier. When a virtual thread later runs on another carrier, it can use that carrier’s current allocation state. Objects allocated earlier remain normal heap objects regardless of the carrier change.
This is a HotSpot implementation explanation, not a promise about all JVMs. It is also separate from which Java thread identity a profiler attaches to an event. Allocation-buffer ownership and diagnostic attribution should not be inferred from each other.
Allocation rate, cost, and retention answer different questions
Imagine two services allocating 2 GB per second. These are illustrative workloads, not benchmark results. In one, 99% of the allocated bytes die before the next young collection. In the other, a large fraction survives repeatedly and is eventually promoted.
Both services consume allocation space quickly. Their collector workloads can differ substantially because surviving objects need preservation, often involving copying, and promotion adds old-generation pressure. A fast allocation path does not make those later costs disappear.
Likewise, a high allocation rate does not directly measure CPU time in allocation, and it does not prove high retention. Short-lived allocation can still consume bandwidth, trigger frequent collections, and affect latency. Low survival is helpful, not a guarantee of acceptable performance. Compare allocation throughput with CPU, pauses, survival, promotion, and retained heap under the actual workload.
Choose the JFR signal that matches the question
JDK Flight Recorder offers several allocation signals. Their names sound similar, but they describe different observations. The distinctions below follow JDK 25 metadata and HotSpot implementation; recording settings determine what is captured.
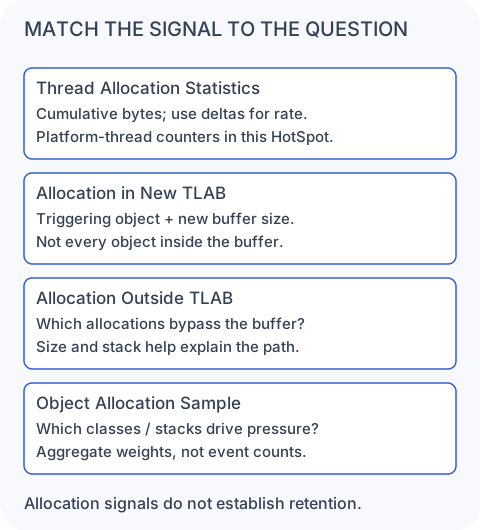
Thread Allocation Statistics (jdk.ThreadAllocationStatistics) reports an approximate cumulative byte count since thread start. Differences between observations over elapsed time give a throughput estimate; a single counter is not a rate. In this HotSpot version the periodic producer reads platform/HotSpot thread counters, so do not interpret it as a complete set of independent counters for every virtual thread.
Object Allocation in New TLAB (jdk.ObjectAllocationInNewTLAB) describes the allocation associated with obtaining a new TLAB. It includes the triggering object’s class and allocation size, plus the buffer size. It is not an event for every object allocated inside that TLAB. Assigning the whole buffer to the triggering object’s class would misattribute the other objects that later use it.
Object Allocation Outside TLAB (jdk.ObjectAllocationOutsideTLAB) records allocations through the outside-TLAB path when enabled. Class, allocation size, and a configured stack trace help investigate which code uses this path. It does not establish that the allocation was slow or that the object will survive.
Object Allocation Sample (jdk.ObjectAllocationSample) provides weighted samples for estimating allocation pressure by class, thread, or stack trace. Aggregate sample weights rather than treating each recorded event as one equally sized object. Sampling is a statistical view, not an exhaustive allocation census.
For a practical investigation, first inspect the recording’s enabled events and stack settings. Use counter deltas to locate high throughput and weighted samples to locate contributing code. Inspect new-TLAB and outside-TLAB events for the allocation-path question, then use GC and heap evidence for survival and retention. Missing events can reflect recording settings; they are not proof that no allocation occurred.
Check your reasoning
Two services allocate 3 GB per second. Service A mostly uses the TLAB fast path and 99.8% of its allocated bytes die young. Service B has a large survivor set and high promotion. Does the equal allocation rate imply equal memory-management cost?
Pause here, then check your reasoning
No. Service B is likely to require more work preserving and promoting surviving data. The rate alone measures neither allocator CPU nor retention. Service A still needs measurement: rapid short-lived allocation can consume bandwidth and cause frequent collections even when its survivor set is small.
Now suppose JFR records a Customer allocation in a new TLAB, followed by many Order allocations inside the same buffer. Does that event count all the Orders? And if a virtual thread switches carriers, does it take this TLAB with it?
Check the event and ownership boundaries
The new-TLAB event describes the triggering Customer allocation and buffer size, not every subsequent Order. Weighted allocation samples are more useful for estimating which classes drive allocation pressure. The virtual thread does not take a permanent TLAB between carriers; it uses the allocation machinery of the carrier on which it executes. Previously allocated objects remain ordinary heap objects.
Put the allocation lifecycle together
We can now connect object creation to the GC work from earlier lessons. In the classic generational picture, an ordinary object is allocated in young heap space, initialized, used, and eventually either reclaimed or preserved according to reachability. Survivors may move through survivor space and eventually be promoted. A TLAB sits inside allocation space; it is not a separate generation an object passes through before Eden.
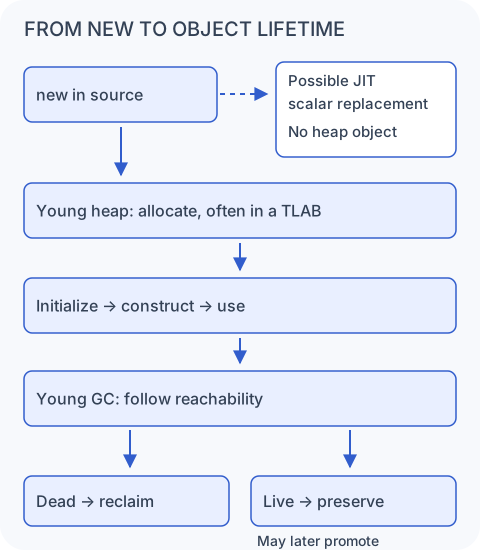
There is one earlier question left: must the object exist as a separately allocated heap object at all? If the JIT can analyze how a value is used, escape analysis can help enable scalar replacement, representing its fields without materializing the original object. That is an optimization possibility, not a guarantee for every local variable, and it does not mean HotSpot generally moves such objects onto the stack.
The escape analysis and scalar replacement lesson is the next step: from making allocation cheap to understanding when an allocation can disappear.
Sources and implementation boundaries
Adapted from Daily JVM Byte #8 and its reviewed draft. Sizes, rates, pseudocode, and service comparisons are illustrative rather than measured output. Primary references are pinned to JDK 25 where possible.