You’ve written some Java code. You start the application, and it begins doing its job. Somewhere between those two things, the JVM enters the picture.
What does it actually do?
The Java Virtual Machine, or JVM, is the software that runs your compiled Java program and manages the resources it needs along the way. It gives your code somewhere to execute, provides memory for its data, and takes care of jobs such as reclaiming memory that is no longer needed.
That’s the picture we’ll build in this lesson. By the end, you should be able to sketch the JVM’s main parts and explain what each one contributes. You don’t need to know how a garbage collector or a JIT compiler works yet. We’re going to meet them first.
From your code to a running program
Let’s start with something familiar: a Java source file. In the usual compile-and-run workflow, two different tools do two different jobs.
First, javac, the Java compiler, turns your .java file into a .class file. That class file contains bytecode: instructions intended for a JVM, along with information describing the class. Bytecode is an intermediate form of your program. It isn’t the Java source you wrote, and it isn’t native machine code for your particular CPU.
Then you start the program with a command such as java MyApplication. The Java launcher starts a JVM, which loads the program and begins running it. Follow that handoff in the picture below.
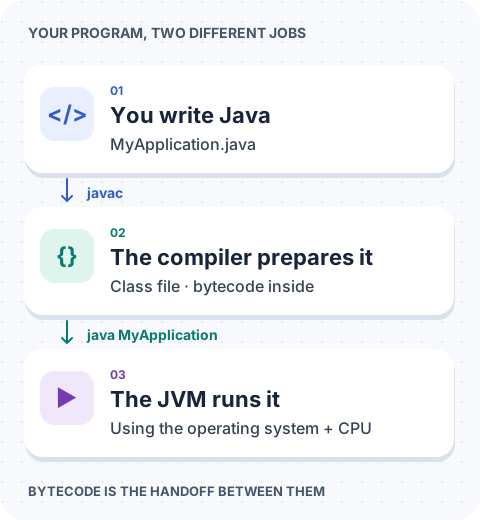
The word virtual can make this sound more mysterious than it is. Think of the JVM as a machine implemented in software. It understands its own instruction set, bytecode, and makes those instructions run on the actual computer underneath. It doesn’t replace the operating system: it uses the OS for resources such as memory and CPU time.
This separation is also part of Java’s portability story. The same class files can run on compatible JVMs on different platforms. The JVM implementation handles the platform-specific work, although your application still needs compatible libraries and must account for any platform-specific dependencies it uses.
Throughout this course, we’ll usually look at HotSpot, the JVM implementation used by many OpenJDK distributions. “JVM” names the kind of runtime; “HotSpot” names a particular implementation. Details such as its JIT compiler and memory organization belong to that implementation.
A tour of the JVM
Running a program involves more than carrying out its instructions. Classes need to be brought in, data needs somewhere to live, and work needs to be managed while the application runs.
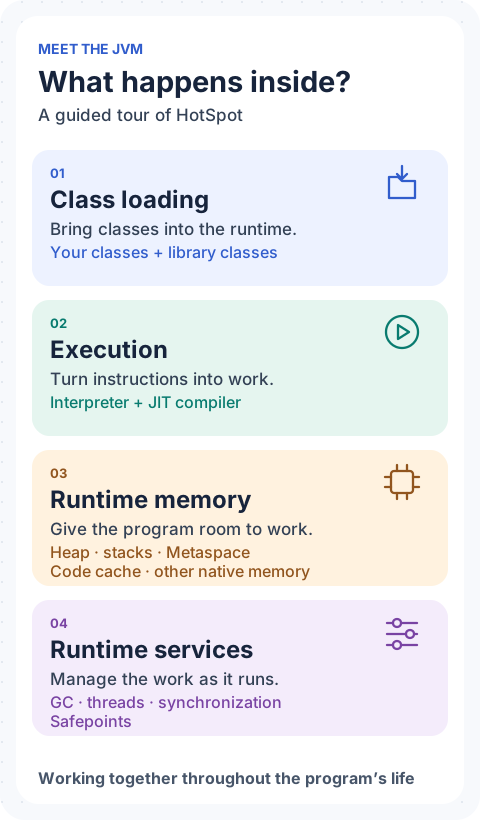
We can organize those jobs into four parts. Read the map once to get your bearings, then we’ll walk through each part together. The numbers are stops on our tour, not a fixed sequence that happens only at startup.
1. Class loading brings the pieces in
Your application uses classes: the ones you wrote, the ones from libraries, and the ones supplied by Java. Before it can use a class, the JVM needs to find its compiled form and make it available inside the running program.
That’s where class loading comes in. Related steps check the class and prepare it for use. The JVM also keeps information about it, such as the methods and fields it contains. You can think of this as bringing the program’s building blocks into the runtime. It can happen as more classes are needed, rather than all at once before your code starts.
2. Execution makes the code do something
Once a method is ready to run, its instructions need to become actual work on the CPU. HotSpot has two important tools for this: an interpreter, which carries out bytecode instructions, and a just-in-time compiler, usually called the JIT, which can turn frequently executed code into native machine code.
Here’s the interesting part: HotSpot can observe the program while it runs and use those observations to guide optimization. A method may be interpreted earlier and use compiled code later. The program’s behavior must stay correct, but the way HotSpot carries out the work can change.
The key idea is that execution can change while the application runs. A simplified journey looks like this:
Bytecode → interpreter
    ↓
Runtime profiling
  • invocation counts
  • branch behavior
  • receiver types at method calls
    ↓
Hot method → JIT compilation
    ↓
Native machine code
Those observations help HotSpot decide what to compile and how to optimize it. This isn’t a required path for every method: with tiered compilation, compiled code can also collect profiles for further optimization. We’ll explore those decisions when we reach JIT compilation.
3. Runtime memory gives everything a place to live
It’s easy to hear “Java memory” and think only of the heap. But an application needs space for more than its objects.
Suppose your code creates a Customer. Conceptually, Java objects live on the heap; HotSpot may optimize some allocations away. We’ll return to that distinction when we meet escape analysis and scalar replacement. The running method also needs space to keep track of its work. HotSpot needs information describing the Customer class, and it needs somewhere to keep any machine code the JIT produces.
These names describe the main places you’ll encounter:
- Java heap: space for objects and arrays.
- Thread stacks: frames that keep track of method calls and their working data.
- Metaspace: native memory used for much of HotSpot’s class metadata.
- Code cache: space for generated machine code, including JIT-compiled code.
- Other native memory: space for the JVM’s own work, including compiler and garbage collector data structures.
You don’t need to memorize all of these today. Notice why they exist: storing an object, tracking a method call, and keeping compiled code are different jobs. Also, “native memory” is a broader category: Metaspace, for example, is itself native memory, not part of the Java heap.
4. Runtime services keep the work moving
While your code runs, the JVM also manages the environment around it.
Garbage collection reclaims heap space occupied by objects that are no longer needed. Thread management supports the threads doing the work. Synchronization, used by mechanisms such as synchronized, helps coordinate access to shared data.
You’ll also meet safepoints. These let HotSpot coordinate certain runtime operations at points where the relevant thread state can be examined safely. We can leave their mechanics for later. Their place on this map is alongside the work needed to manage a running program.
This is what managed runtime means here. You write the application’s logic, and the JVM handles many of the tasks needed to execute and manage it. Those services still consume CPU time and memory, so they’re part of the application’s performance picture too.
Put the pieces together
Let’s return to a small method:
int calculate(int x) {
    return x * 2;
}
In your source, it’s a multiplication and a return. Around that small piece of logic, several things are happening.
The compiler turns the method into bytecode. When the application uses the class containing it, the JVM brings that class into the runtime. Executing the method involves a thread and a method frame to hold its working state. HotSpot may interpret the method, and if it becomes worth optimizing, the JIT may compile it. Generated machine code then needs space in the code cache.
Meanwhile, runtime services continue doing their jobs for the application as a whole. A call to this method doesn’t automatically trigger garbage collection or a safepoint. The parts cooperate when needed; they aren’t a chain of steps that every method must pass through.
That’s why describing the JVM as a bytecode interpreter leaves so much out. Interpretation is one way it executes code. The JVM also supplies the memory and services around that execution.
Three systems to keep in mind
You can now group the runtime into three connected systems:
             Memory
                │
Execution ──────┼──── Runtime Services
Execution does the work, memory holds its code and data, and runtime services coordinate and manage it. Class loading brings new code and metadata into this running system.
For example, imagine a compiled method working with a Customer object. Its machine code lives in the code cache, while the object lives on the heap. When GC needs to inspect the thread’s references, runtime coordination provides a safe state to do so, using safepoints where required. The JIT supplies maps of object-reference locations in compiled frames and registers, so GC can find objects the method still needs. Compiling a method doesn’t disconnect it from memory management.
Use the map before reaching for a setting
Here’s a useful consequence of this bigger picture. Suppose you set a maximum Java heap of 512 MB, but your application’s process uses more memory than that. Has the JVM ignored your setting?
Pause here, then check your reasoning
No. The heap is only one part of process memory. Thread stacks, Metaspace, the code cache, and other native allocations also need space. The -Xmx option limits the Java heap; it doesn't cap the whole process.
In production, start with three questions: Memory? Execution? Runtime coordination? Unexpected process growth points you toward memory; high CPU usage could involve application code, compilation, or GC; a slow request might be waiting for a lock or runtime coordination. These are starting categories, not diagnoses, and they can overlap. Use evidence to work out which systems are involved before changing a setting.
The next lesson on JVM process memory explains where the heap fits alongside stacks, class metadata, compiled code, and native allocations.
Sources and further reading
- JVM specification: the abstract machine, class files, and runtime data areas
- JVM specification: loading, linking, and initialization
- HotSpot: tiered compilation, code cache, and allocation elimination
- HotSpot: class metadata and native memory
- Java launcher and heap size options
- OpenJDK: runtime coordination and thread-local handshakes
- OpenJDK: object-reference maps for compiled code and GC