In the previous lessons, C1 and C2 kept producing something increasingly important: native machine code. C2 might compile a method, HotSpot might later invalidate that version, and another compilation might replace it.
That raises a physical question: where do all those generated instructions live?
HotSpot stores JVM-generated executable code in a native-memory area called the Code Cache. It gives compiled Java methods and other runtime-generated code an address from which the CPU can fetch instructions.
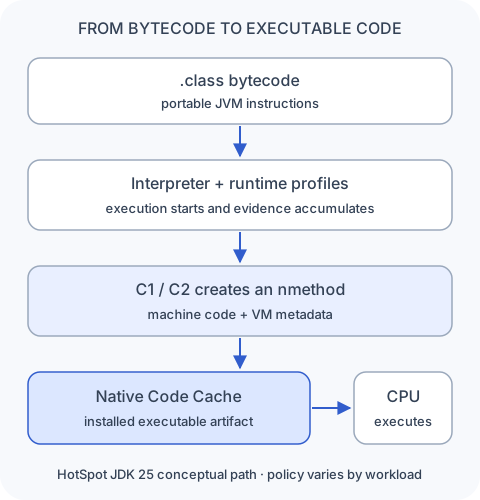
The complete path is:
.class bytecode
       │
       ▼
interpreter + runtime profiles
       │
       ▼
     C1 / C2
       │
       ▼
 nmethod installed in Code Cache
       │
       ▼
 CPU executes machine instructions
This lesson follows JDK 25 HotSpot. The JVM specification defines bytecode and Java execution semantics, but it does not require this Code Cache organization or HotSpot’s nmethod representation.
Compiled Java code needs executable memory
Suppose HotSpot compiles this method:
int add(int a, int b) {
    return a + b;
}
The class file contains JVM bytecode such as iload, iadd, and ireturn. The interpreter can execute those bytecodes. Once the method becomes worth compiling, C1 or C2 translates its behavior into instructions for the current processor architecture.
Those instruction bytes need an executable address. HotSpot allocates space for the compiled-method artifact, installs it in the Code Cache, and can route later invocations into its entry point. That is the physical step hidden inside the phrase “the JIT compiled the method.”
The Java heap stores Java objects. The Code Cache stores JVM-generated executable code and its supporting data.
The Code Cache also contains runtime-generated code that is not a compiled Java method, so it is broader than “a folder full of C2 output.” We will separate those categories shortly.
The Code Cache sits outside the Java heap
Recall the process-memory model from Lesson 2:
JVM process

├── Java heap
├── Metaspace
├── thread stacks
├── Code Cache
├── GC and compiler structures
└── other native memory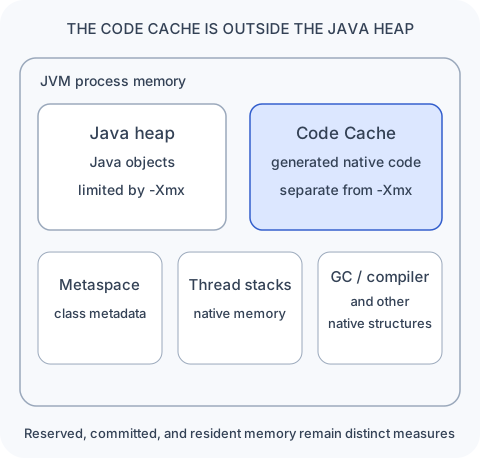
-Xmx limits the Java heap, not the whole JVM process or the Code Cache. Open full-size diagram.For example, -Xmx4g places a limit of roughly 4 GB on the Java heap. It does not promise that the process resident set size, container usage, or virtual-memory reservation will be 4 GB. Code Cache pages contribute outside that heap budget, alongside thread stacks, Metaspace, direct memory, and VM structures.
This distinction matters when a container approaches its memory limit while heap occupancy and GC both look healthy. It does not prove that the Code Cache is the cause, but it prevents the mistaken conclusion that healthy heap numbers describe the whole process.
HotSpot can divide the cache into three Code Heaps
JDK 25 HotSpot can segment the Code Cache into Code Heaps. The Java launcher documentation names three categories when -XX:+SegmentedCodeCache is enabled:
- profiled methods;
- non-profiled methods;
- non-method code.
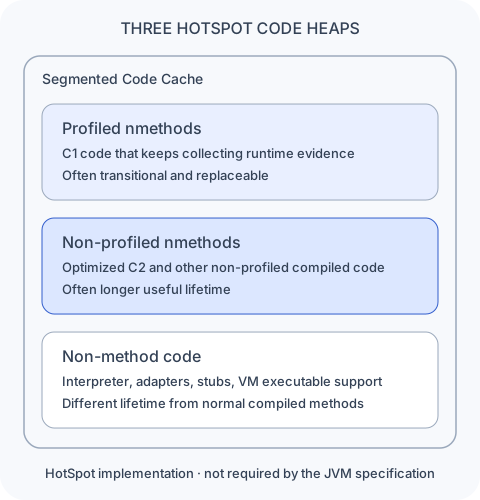
The local JDK 25.0.2 used for this lesson starts with segmented Code Cache enabled. That observation describes this HotSpot build and configuration, not a portable JVM guarantee.
Profiled nmethods
Some C1 compilation levels produce native code that keeps collecting execution profiles. That instrumentation helps HotSpot decide whether a method is worth a later, more expensive optimization. These transitional compiled versions typically go into the profiled Code Heap.
C1 code with profiling instrumentation
                 │
                 ▼
        profiled nmethods heap
Non-profiled nmethods
Fully optimized C2 code normally has no profiling instrumentation and goes into the non-profiled Code Heap. Some C1 code can be non-profiled too; the category describes the installed code, not a strict “C1 heap versus C2 heap” split.
non-profiled compiled method
              │
              ▼
    non-profiled nmethods heap
Non-method code
HotSpot also needs generated executable machinery that is not an ordinary compiled Java method. This heap includes code such as the bytecode interpreter and runtime adapters. The JDK documentation describes this code as staying in the cache rather than following the replaceable lifetime of normal compiled methods.
non-method heap

├── bytecode interpreter code
├── runtime adapters and stubs
└── other VM-generated executable support
The three heaps are separately sized and are not resized at runtime. A comfortable total percentage can therefore hide pressure in one particular heap.
An nmethod is more than its instructions
HotSpot calls its compiled version of a Java method an nmethod. The current JDK source describes an nmethod as a structure containing a header, constants, a code body, handlers, stubs, object-reference tables, relocation data, and other metadata.
That detail matters because optimized code must remain understandable to the rest of the runtime.
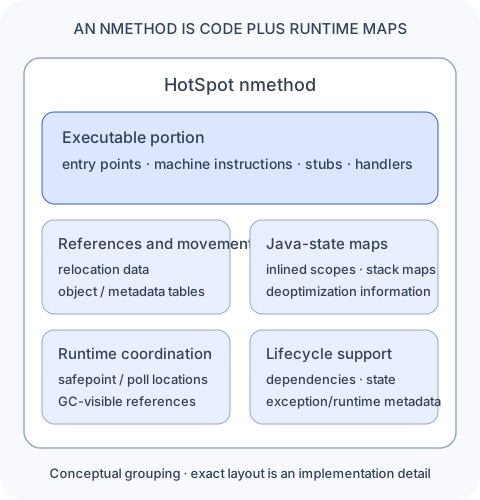
nmethod combines executable instructions with the maps and metadata HotSpot needs to manage those instructions safely. Open full-size diagram.Consider the questions HotSpot may need to answer while a thread runs compiled code:
- Which registers or stack locations contain object references?
- Which Java methods were inlined into this machine-code range?
- Which machine locations correspond to usable safepoint state?
- How can a stack walker describe the current Java calls?
- How can deoptimization reconstruct locals, operand stacks, and inlined frames?
- Where should an exception continue?
Raw CPU instructions alone cannot answer those questions. The runtime needs mappings between optimized machine state and Java-level state.
In HotSpot, compiled code is machine instructions plus enough metadata for GC, stack walking, exceptions, safepoints, and deoptimization to remain in control.
This connects directly to Lesson 15. C2 may inline A → B → C into one compiled body, leaving no ordinary physical call frame for each source method. The metadata attached to that code can still describe the logical Java frames and values that recovery must rebuild.
The JDK 25 nmethod source exposes those code, relocation, object-reference, exception, polling, and deoptimization relationships. They are implementation details, but they explain why “compiled method” means more than a byte array.
Compiled code moves through a lifecycle
The Code Cache is not append-only storage. A method may receive a profiled C1 version, later receive a C2 version, lose an assumption, and eventually be compiled again from newer evidence.
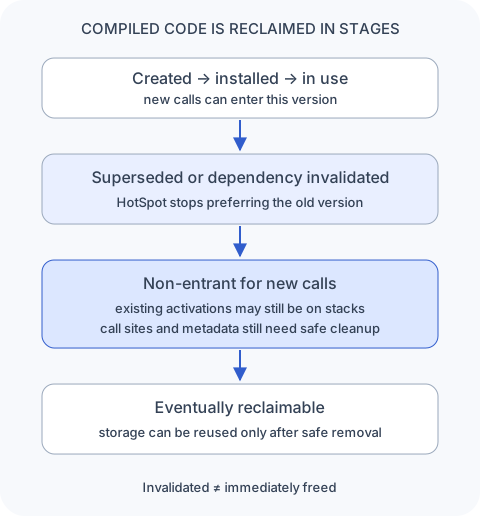
A useful simplified sequence is:
created → installed → executed
                       │
                       ▼
             superseded or invalidated
                       │
                       ▼
        non-entrant for new executions
                       │
                       ▼
             eventually reclaimable
In JDK 25 source, not_entrant explicitly allows activations of the old method to still exist. HotSpot cannot reuse those bytes merely because it has stopped sending new calls there. It must also account for active frames, call-site references, dependencies, and runtime metadata before reclamation is safe.
Invalidating an nmethod does not immediately free its Code Cache storage.
That is why “cache” is a useful name. Generated versions can be installed, replaced, and later reclaimed; the area is managed executable storage rather than a permanent archive of every compilation.
Check your reasoning: why can two compiled versions of one method occupy space at the same time?
A newer version can become the target for new calls while an older non-entrant version still has active frames or runtime references. HotSpot preserves the older artifact until it can prove that reclaiming it is safe.
Segmentation groups different lifecycles
Imagine one allocation area mixing profiling code, long-lived optimized code, interpreter machinery, and runtime adapters. When replaceable blocks disappear between longer-lived blocks, the free bytes can become scattered into holes.
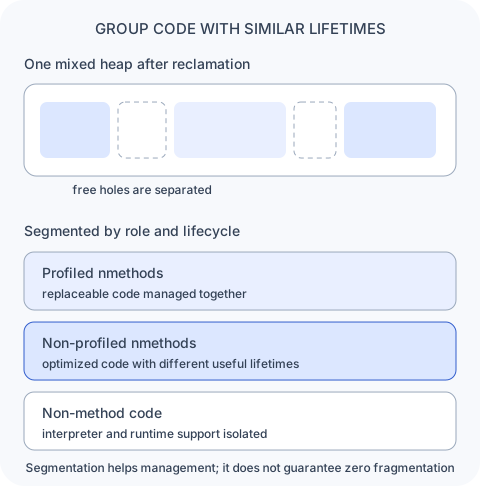
Segmentation helps HotSpot manage those different lifetimes separately. The JDK 25 launcher documentation also lists reduced fragmentation, footprint control, and improved instruction-cache and instruction-TLB locality as benefits of segmented Code Cache.
The idea resembles generational GC only at a high level: group allocations with different expected lifetimes. Code Heaps are not Java heap generations, and reclaiming compiled code is not ordinary object garbage collection.
Pressure can constrain compilation while the heap looks healthy
JIT compilation produces a result that must be installed before application threads can execute it. If the relevant Code Heap lacks usable space, producing the machine code is not enough.
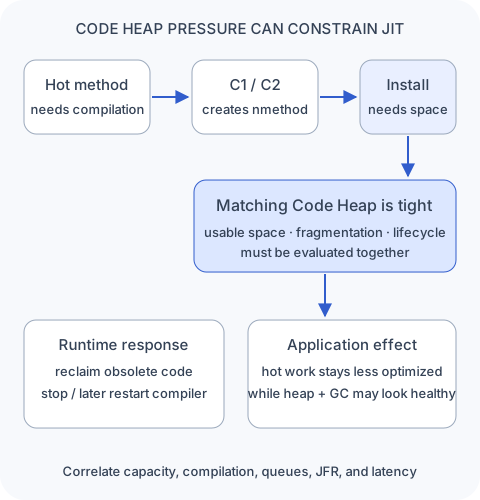
The JDK 25 JFR event metadata describes CodeCacheFull as a full code heap that leads to disabling the compiler. HotSpot also records JITRestart when compilers restart after memory has been freed. This can create a production picture such as:
Java heap          healthy
GC                 ordinary
application        slower or less stable
compiler activity  changed
Code Heap          constrained
That pattern does not prove a Code Cache problem. It tells you to investigate the compiled-code pipeline rather than restricting the diagnosis to heap and GC.
One percentage is not a diagnosis
Suppose a summary says the Code Cache is 70% used. That total alone cannot tell you whether JIT compilation is healthy.
Ask several related questions:
- Which Code Heap is using the space?
- How much contiguous or otherwise usable capacity remains in that heap?
- Are obsolete methods becoming reclaimable and being reclaimed?
- Is compilation still enabled, stopped, or repeatedly restarting?
- Are compilation events succeeding?
- Are C1 or C2 queues growing while application performance changes?
Capacity, allocation shape, lifecycle, and compiler activity are different signals. Correlating them gives a stronger explanation than treating one occupancy number as a threshold with a universal meaning.
Inspect the cache before changing it
A small startup check is:
java -XX:+PrintCodeCache -versionOn the local Homebrew OpenJDK HotSpot 25.0.2 used to validate this lesson, the trimmed output was:
CodeHeap 'non-profiled nmethods': size=120048Kb ...
CodeHeap 'profiled nmethods':     size=120016Kb ...
CodeHeap 'non-nmethods':          size=5696Kb   ...
CodeCache: size=245760Kb ... full_count=0
Compilation: enabled, stopped_count=0, restarted_count=0
This one short-lived process does not model a production workload. It does show the three heaps, their separate sizes, the aggregate cache, a full counter, and whether compilation is enabled.
The matching JDK 25 sizing flags include:
-XX:ReservedCodeCacheSize=...
-XX:ProfiledCodeHeapSize=...
-XX:NonProfiledCodeHeapSize=...
-XX:NonNMethodCodeHeapSize=...
ReservedCodeCacheSize sets the overall maximum reservation. The other flags divide capacity among the three segments when segmented Code Cache is enabled. The official JDK 25 java documentation describes the heap categories, flags, and locality/fragmentation trade-offs.
JFR provides runtime evidence to correlate with that capacity view. Depending on the recording configuration, useful JDK 25 events include compilation results, compiler-queue utilization, Code Cache full events, deoptimization, and JIT restart. The JDK 25 JFR event metadata is the implementation-level source for those event fields.
Code Cache pressure deserves more attention in very large applications, long-running processes, workloads with many hot methods, heavy dynamic code generation, or repeated compilation and invalidation. For an ordinary application with sensible defaults, it is rarely the first explanation to test.
The complete model leads to safepoints
The adaptive-execution pipeline now has both an output artifact and a physical location:
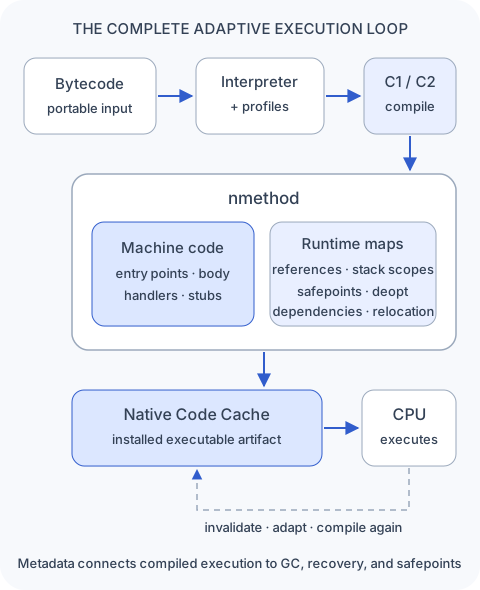
That metadata gives us the bridge to the next planned lesson. GC and other VM operations sometimes need every Java thread to reach an execution state that HotSpot knows how to inspect. Compiled code must cooperate by exposing suitable locations and maps.
The next lesson follows safepoints: how HotSpot coordinates threads at known execution states, how generated code participates through polling, and why the time required to reach a safepoint differs from the VM operation performed there.
Check your reasoning: why can healthy heap and GC graphs coexist with a JIT-related slowdown?
The Java heap and the Code Cache are different memory systems. If a Code Heap cannot accept new compiled methods, HotSpot can constrain JIT activity even though object allocation and garbage collection remain healthy. Confirm that explanation with per-heap capacity, compilation state, queue activity, JFR events, and application timing rather than one graph.
Sources and implementation boundaries
Adapted from Daily JVM Byte #16 and its reviewed draft. Diagrams and lifecycle flows are conceptual. The PrintCodeCache startup check was executed on Homebrew OpenJDK HotSpot 25.0.2; it is a short-lived observation rather than a workload measurement. Code Cache organization, policy, and event details describe HotSpot and can vary by build and configuration.