The previous lesson ended with an nmethod that contains more than native instructions. It also carries reference maps, stack information, deoptimization state, and safepoint metadata.
Why does compiled code need all of that?
While application threads keep changing JVM state, HotSpot sometimes needs a coordinated view of those threads. A stop-the-world garbage-collection phase is one example, but it is not the only one. HotSpot must first establish that every relevant Java thread is in a state the runtime can safely understand.
That globally coordinated state is a safepoint.
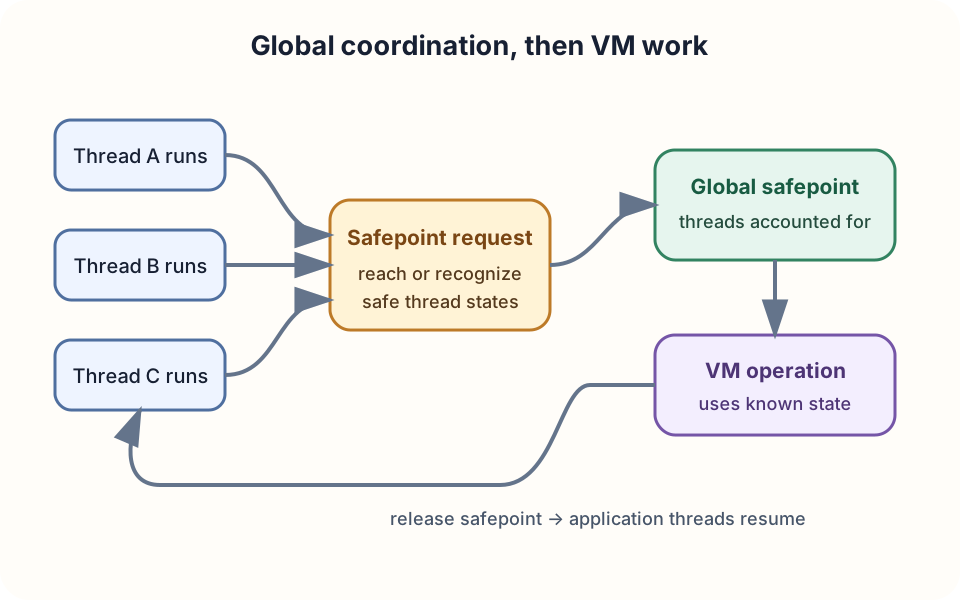
A safepoint is fundamentally a HotSpot coordination state, not merely a location in code or an operating-system freeze.
This lesson describes JDK 25 HotSpot. The Java Virtual Machine Specification defines Java execution semantics, but it does not require HotSpot’s safepoint protocol, polling implementation, or metadata layout.
Why arbitrary machine instructions are difficult to inspect
Consider a stop-the-world GC phase. To begin tracing the heap, the collector needs roots from active thread state:
Thread A frame ─────► Customer
Thread B frame ─────► Order
Thread C frame ─────► Cache
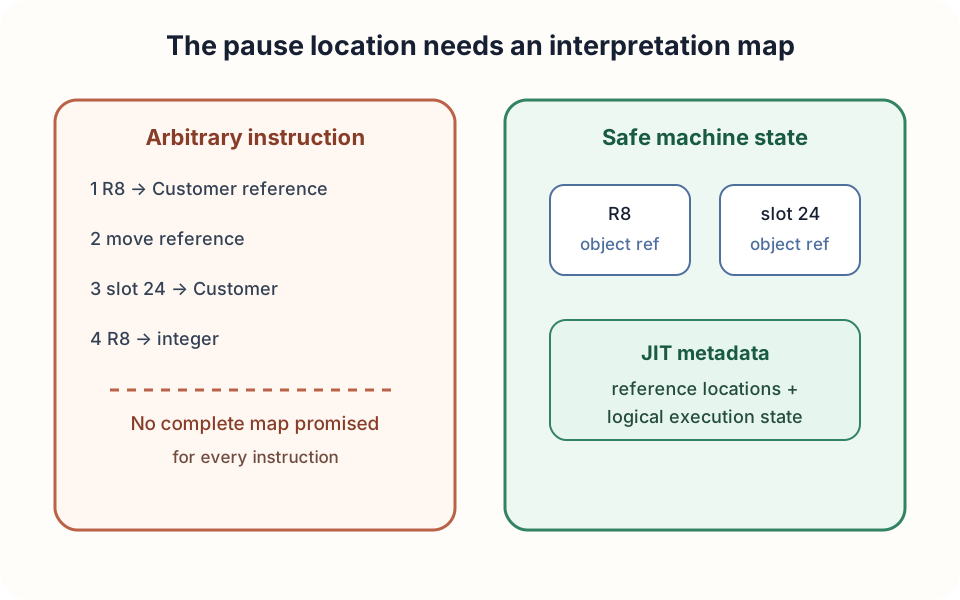
In interpreted execution, the logical frame model gives us local variables and an operand stack. Optimized machine code can represent the same Java state very differently. A reference may live in a CPU register, move to a machine-stack slot, or temporarily have no source-shaped home at all.
instruction 1   R8 contains Customer reference
instruction 2   reference moves to stack slot 24
instruction 3   R8 is reused for an integer
Freezing at an arbitrary instruction would leave HotSpot asking which locations contain object references, which values are live, and which logical Java frames the optimized body represents. The runtime does not need a complete Java-state description for every instruction. It coordinates around machine states for which the compiled code has suitable metadata.
A safepoint is a global state, not one instruction
The word safepoint is used in two nearby ways. Developers may call a polling or metadata-bearing location in compiled code a safepoint. HotSpot also uses the term for the global state reached after the required Java threads have been accounted for.
For this lesson, keep the global sequence in view:
safepoint request
       │
       ▼
threads cooperate or become accountable
       │
       ▼
global safepoint state
       │
       ▼
VM operation executes
HotSpot’s JDK 25 source describes SafepointSynchronize::begin() as rolling Java threads forward to a safepoint. Its synchronized state means Java threads are stopped at a safepoint, running in native code, or blocked in the operating system. That definition already shows why “every OS thread is forcibly suspended at the same instruction” is the wrong model.
Different thread states take different paths
Suppose four Java threads are in four different situations when the request arrives:
Thread A → executing compiled Java
Thread B → blocked
Thread C → executing native code
Thread D → executing interpreted Java
Thread A may need to reach a poll and enter runtime coordination. Thread B may already be in a state HotSpot can account for. Thread C is outside ordinary Java execution and participates through the Java/native transition protocol. Thread D cooperates through interpreter and runtime machinery.
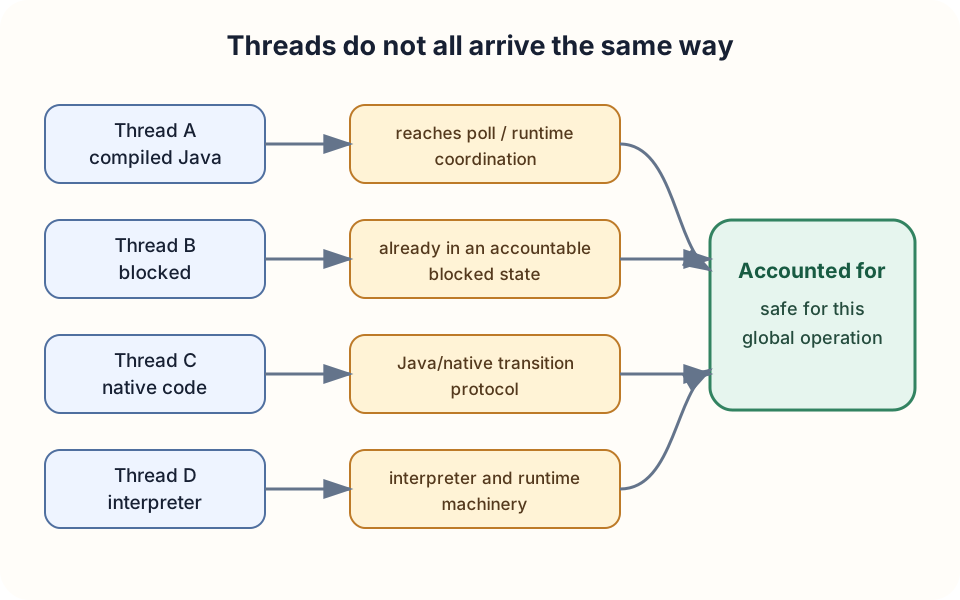
The important invariant is that HotSpot can safely account for the required threads before the operation starts. It is not that every thread executes one identical instruction.
Compiled Java code cooperates through polling
For a thread currently executing compiled Java code, HotSpot uses a cooperation mechanism called a safepoint poll. A useful first model is:
compiled application code
          │
          ▼
     safepoint poll
          │
    request pending?
      /         \
    no           yes
    │             │
    ▼             ▼
continue      enter runtime and cooperate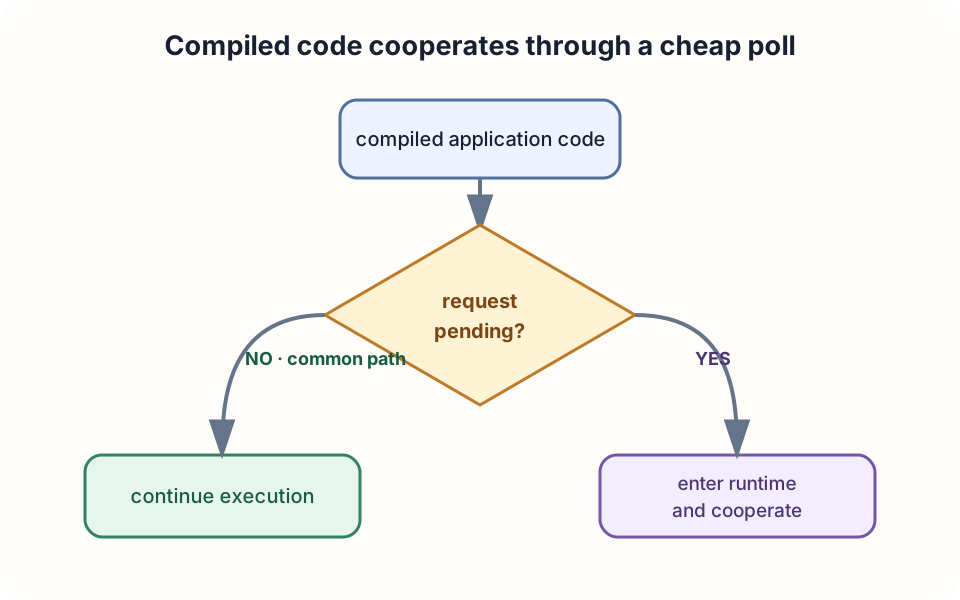
The compiler selects suitable polling and safe-state opportunities around loops, returns, calls, and runtime transitions according to the generated code and platform. Do not turn those examples into a source-level placement rule. It is not accurate to claim that every method call has exactly one poll or that every loop iteration must execute one.
Long-running loops must remain cooperative
Consider a loop whose optimized body can run for a long time:
while (running) {
    calculate();
}
If the compiled execution path had no suitable opportunity to observe runtime coordination, the thread could keep looping while the VM waited indefinitely.
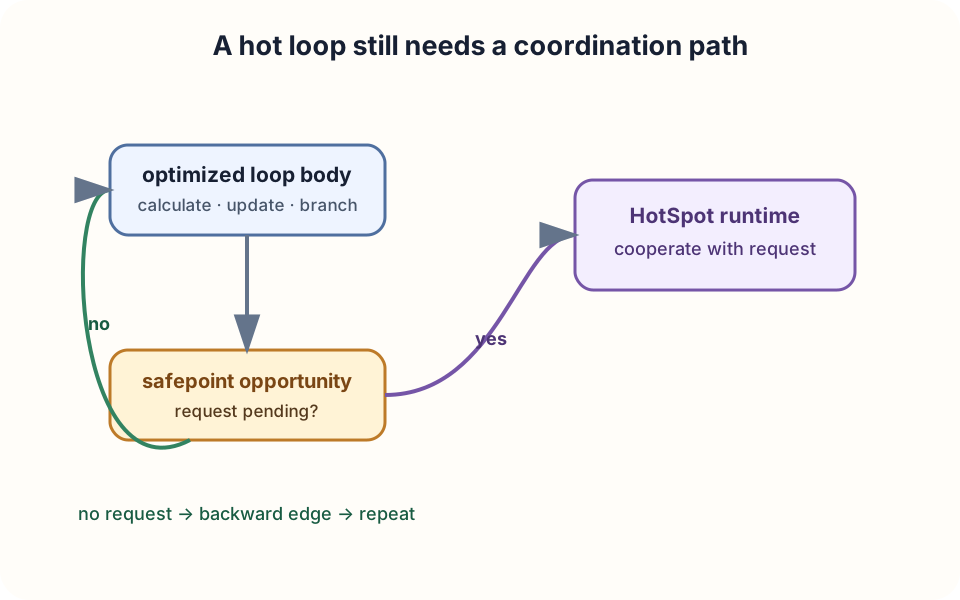
Polling creates a design trade-off. More checks can reduce response latency but add work to hot paths. Fewer checks can make the loop cheaper but delay coordination. HotSpot’s compilers reason about this trade-off; there is no useful universal rule such as “one poll per iteration.”
The global safepoint flow
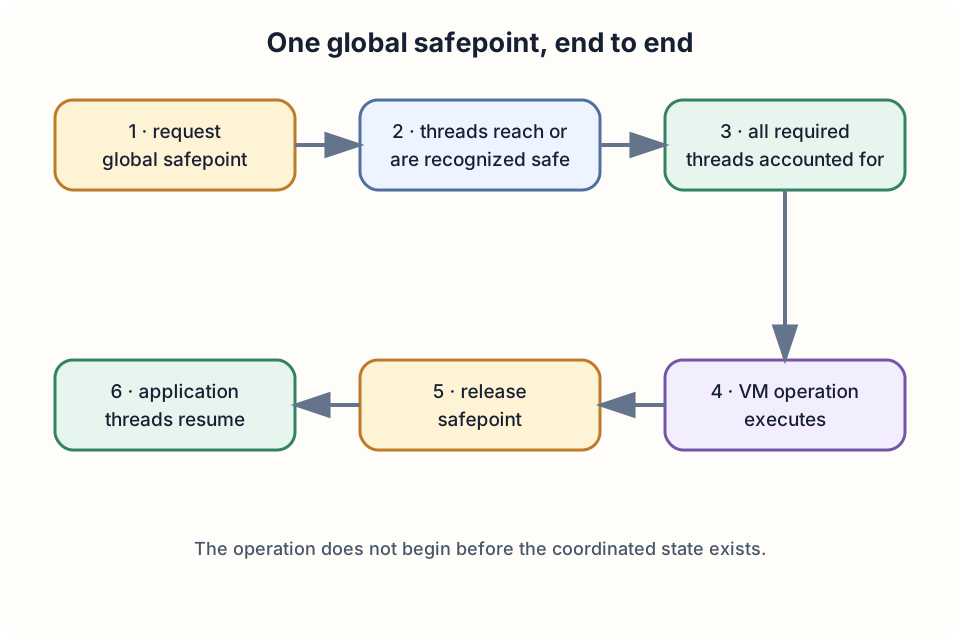
With those pieces in place, we can follow one complete operation:
- A VM operation requests a global safepoint.
- HotSpot activates the coordination mechanism.
- Each required Java thread reaches or is recognized in a safepoint-safe state.
- HotSpot enters the globally synchronized state.
- The VM operation runs.
- HotSpot releases the safepoint and application execution resumes.
A safepoint is not the same thing as GC
Stop-the-world GC makes safepoints visible, but GC is one consumer of global coordination rather than its definition. Other VM operations may also need the threads in a globally safe state.
That changes the first question to ask about a pause:
application pause
       │
       ▼
was there a safepoint?
       │
       ▼
which VM operation requested it?
A JVM pause and a GC pause are not automatically the same event.
Separate synchronization time from operation time
Now we reach the most useful production distinction.
Suppose HotSpot requests a safepoint at time zero. One thread takes 40 milliseconds to become safe. After all required threads are accounted for, the VM operation itself takes 5 milliseconds.
0 ms          safepoint requested
0–40 ms       synchronize: wait for threads
40–45 ms      execute VM operation
45 ms         release and resume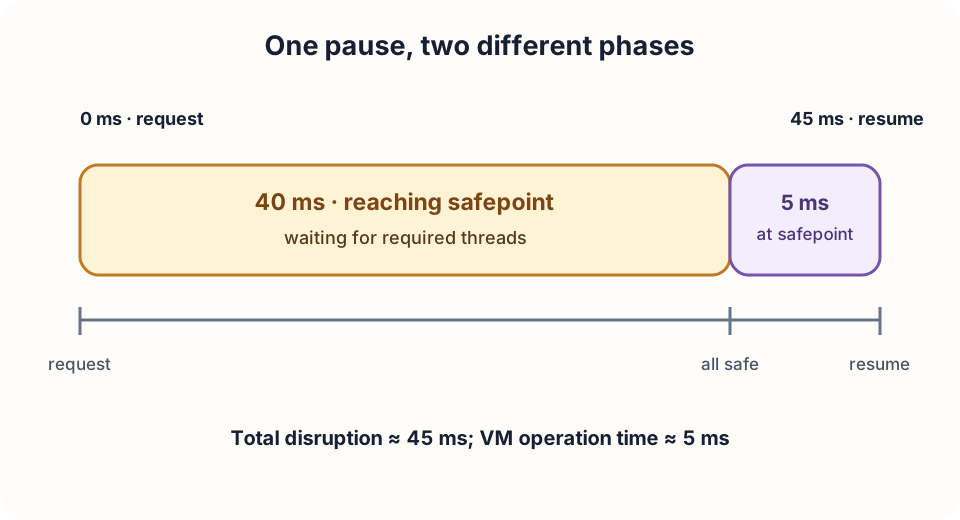
The application experienced roughly 45 milliseconds of disruption, but the VM operation did not take 45 milliseconds. Most of the time was spent reaching the coordinated state.
A long stop-the-world pause does not necessarily mean the VM operation itself was slow; synchronization can dominate the delay.
Older discussions often call the first component time to safepoint. Current unified logs expose the same distinction through fields such as Reaching safepoint and At safepoint. Field names can change across JDK releases, so preserve the reasoning rather than keying a diagnosis to one historical log format.
OopMaps tell HotSpot where references live
Lesson 16 introduced the nmethod as machine code plus runtime metadata. One metadata family is an OopMap: a map that identifies locations containing ordinary object pointers, or oops, at a relevant machine-code position.
Suppose an optimized frame contains:
register R8    → Customer reference
stack slot 24  → Order reference
stack slot 32  → integer 17
HotSpot must not guess which bit patterns are references. At a suitable machine state, compiler-produced maps identify the relevant register and stack locations.
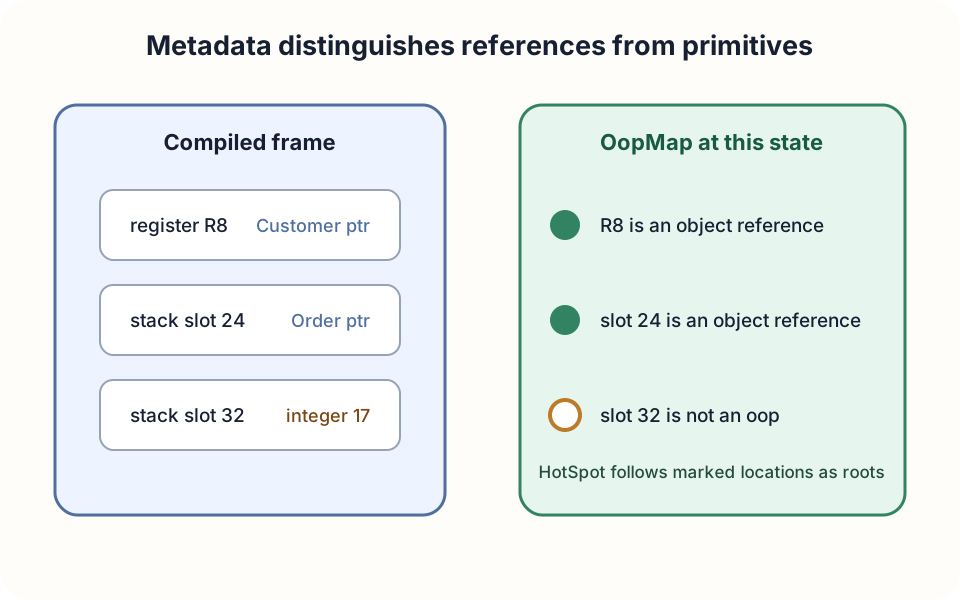
This is one reason a safe state is not merely “the thread is paused.” The runtime also needs the metadata that makes that paused machine state meaningful.
Safepoints connect JIT compilation, GC, and stack walking
Recall the GC-root model from Lesson 4. References held by executing threads can keep heap objects reachable. In compiled code, those references may live in registers and machine-stack slots rather than a literal local-variable array and operand stack.
The JIT therefore produces two cooperating outputs:
JIT compiler
   ├── machine instructions for the CPU
   └── maps describing runtime-visible state
                    │
                    ▼
              safe machine state
                    │
                    ▼
       GC roots and stack walking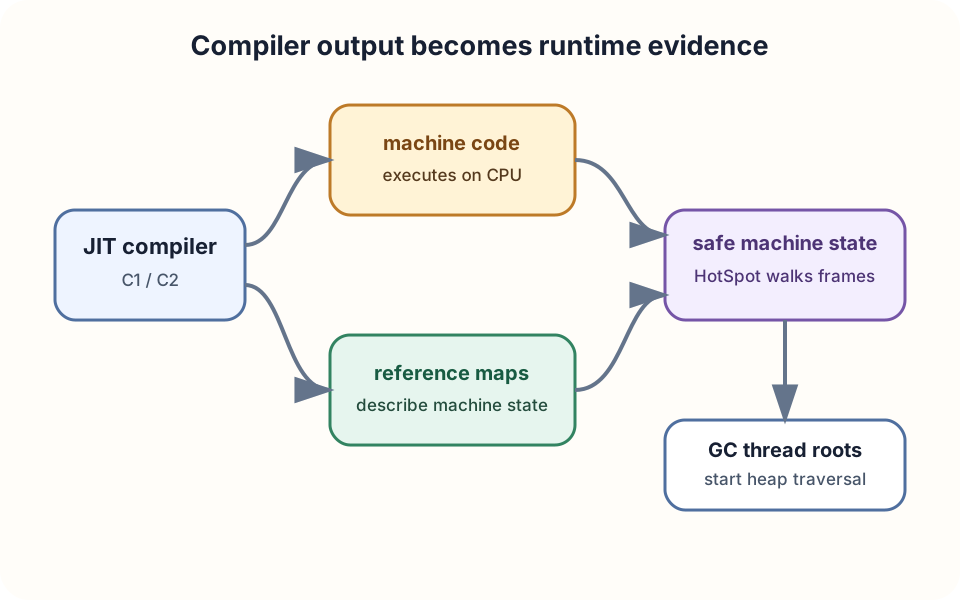
Safepoints also meet Lesson 15’s deoptimization model. When C2 has inlined calls, moved values, or eliminated an object’s physical allocation, HotSpot needs compiler metadata to reconstruct logical frames and Java-visible values at an appropriate recovery point.
Compiled code in HotSpot is machine code plus runtime metadata, so GC, stack walking, deoptimization, and VM coordination can keep the runtime in control.
Global coordination has a real cost
A global safepoint coordinates broadly even when the VM operation is small. As thread counts and execution states vary, establishing the global condition may cost more than the work that follows.
That observation motivates a narrower mechanism. If HotSpot needs one particular thread to perform a small callback, stopping every Java thread can be unnecessary. Modern HotSpot can often use a thread-local handshake to coordinate with selected threads instead. That is the next lesson; it does not replace safepoints, but gives the runtime a more targeted option.
Diagnose the two phases separately
On JDK 25 HotSpot, a practical starting point is unified logging:
java -Xlog:safepoint ...The default info output reports the operation and separates time spent reaching the safepoint, cleanup work, time at the safepoint, and total time. More detailed tag and level combinations are available when an investigation requires them; begin with the smallest signal that answers the question.
The diagnostic chain is:
latency spike
     │
     ▼
was there a safepoint?
     │
     ▼
which VM operation?
     │
     ├── reaching safepoint took long
     └── time at safepoint took long
A safepoint log proves that coordination occurred and reports its timing. It does not, by itself, explain why a particular thread was slow or prove which application-level request was affected. Correlate it with workload timing, thread evidence, GC logs, and other runtime events.
Check your reasoning
Suppose a latency spike lasts 80 milliseconds and the safepoint log reports:
75 ms  reaching safepoint
 5 ms  at safepoint
Is it accurate to say, “the VM operation took 80 milliseconds”?
Pause here, then check your reasoning
No. The application experienced about 80 milliseconds of disruption, but roughly 75 milliseconds were spent establishing the global safe state. Only about 5 milliseconds were spent at the safepoint. The next investigation should focus first on why synchronization was slow rather than assuming the operation itself consumed the entire pause.
Now change the observation:
 2 ms  reaching safepoint
78 ms  at safepoint
What changes?
Pause here, then check your reasoning
Thread coordination completed quickly, so slow arrival is no longer the main suspect. The operation performed while the JVM was at the safepoint accounts for most of the disruption. Identify that VM operation and use evidence appropriate to it, such as GC logs when the operation is GC-related.
Put the coordination model together
We can now connect the execution engine to global runtime work:
Java threads
     │
     ▼
interpreted or compiled execution
     │
     ▼
polls, transitions, and safe states
     │
     ▼
global safepoint synchronization
     │
     ▼
VM operation uses known thread state
     │
     ├── GC-root discovery
     ├── stack walking
     ├── deoptimization support
     └── other global runtime work
     │
     ▼
resume application execution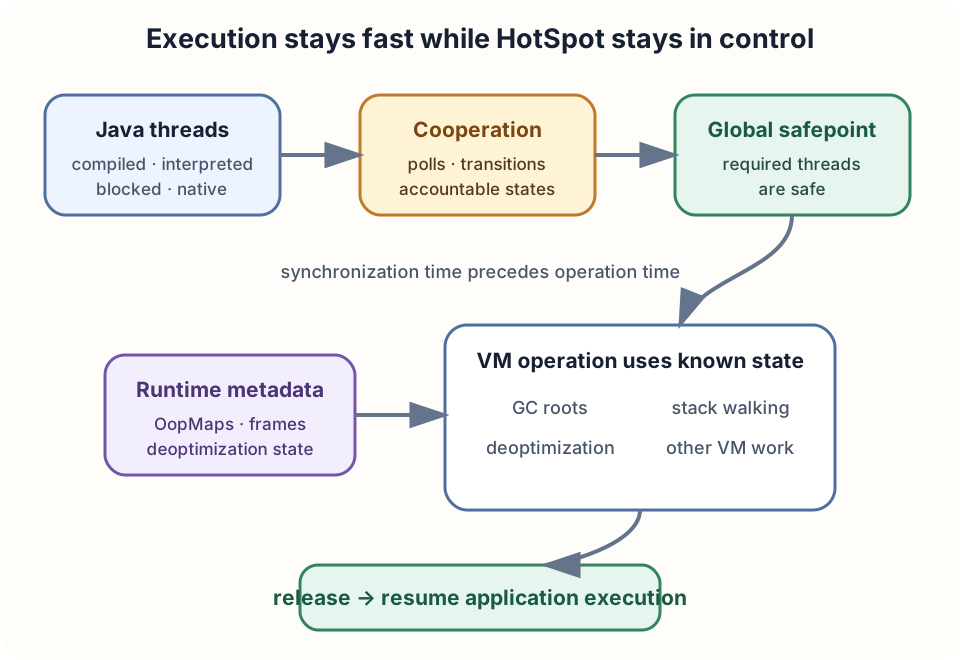
Global coordination is powerful, but it is deliberately broad. The next lesson asks what changes when HotSpot needs cooperation from one selected thread rather than the entire Java-thread set: thread-local handshakes.
Sources and implementation boundaries
Adapted from Daily JVM Byte #17 and its reviewed draft. Timelines, register names, stack slots, and diagrams are illustrative rather than captured runtime output. Claims describe JDK 25 HotSpot implementation; exact polling and logging details can vary by build, platform, and generated code.