You start a Java service and send it some requests. The first requests work, but later requests along the same path may run faster. Your source code has not changed, and you have not restarted the process. What changed?
The JVM may now be using a different executable form of the same Java method.
In Lesson 13, we saw HotSpot start by executing bytecode through the interpreter. We also saw it observe which methods run often, which loops repeat, and which concrete object types receive method calls. HotSpot can use that evidence to compile important bytecode into native machine code made specifically for the current process and CPU.
It does not have to make the largest compilation investment immediately. A common path looks like this:
Interpreter
    ↓
C1: compile sooner
    + keep learning
    ↓
C2: spend more effort
    on deeper optimization
This is tiered compilation. The tiers give HotSpot several levels of investment between “interpret the bytecode” and “spend heavily on optimization.”
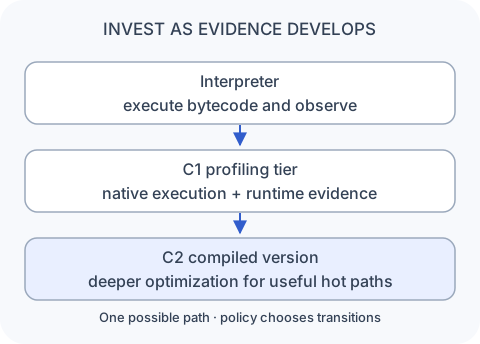
The diagram shows one useful path, not a rule that every method must follow. Some methods never become important enough to compile. Others may skip a tier or be compiled again after the runtime learns something new.
This lesson follows the conventional C1/C2 HotSpot server configuration in JDK 25, where tiered compilation is enabled by default. C1 and C2 are HotSpot compiler names. Java and the JVM specification do not require every JVM implementation to use them.
Why HotSpot has two JIT compilers
We will follow one method through the lesson:
void process(Order order) {
    // validate, price, and save the order
}
Suppose process begins running frequently. HotSpot could compile its bytecode so future calls use method-specific native machine code instead of interpreter handlers.
Compilation is work too. A compiler must inspect the bytecode, decide which optimizations are safe, and generate native instructions. That consumes CPU time and memory now. The generated code also needs somewhere to live. If process runs only a few more times, an expensive compilation might cost more than it saves.
JIT means just-in-time: HotSpot compiles code while the application is running, when it has evidence about which code matters. It uses two main JIT compilers to make different trade-offs:
- C1 spends less time compiling. It applies useful but lighter optimizations and can add small pieces of measurement code that keep recording how the method behaves.
- C2 spends more time analyzing and optimizing. That larger cost can pay off for code that will continue running many times.
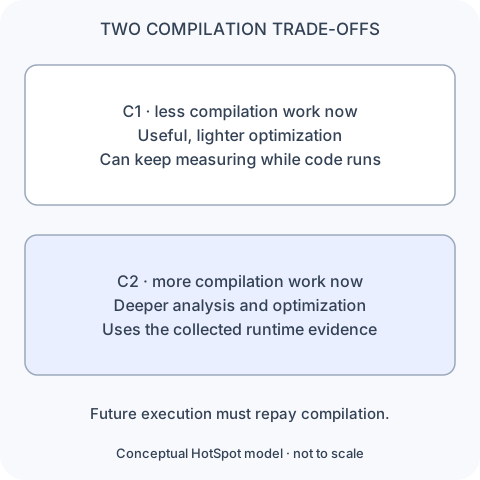
“Fast compiler” and “slow compiler” are useful first labels, but they miss the reason for the two compilers. The real trade-off is:
less compilation work now
        ↕
more optimization for future execution
C1 lets process become native code sooner without paying the full C2 cost. If the method stays hot, the accumulated evidence may later justify a C2 compilation. Both compilers produce native code; neither guarantees one fixed speedup for every method.
The five levels name execution states
HotSpot gives its main execution states level numbers from 0 to 4. The numbers make logs and policy decisions easier to describe. They do not mean a method must climb every step in order.
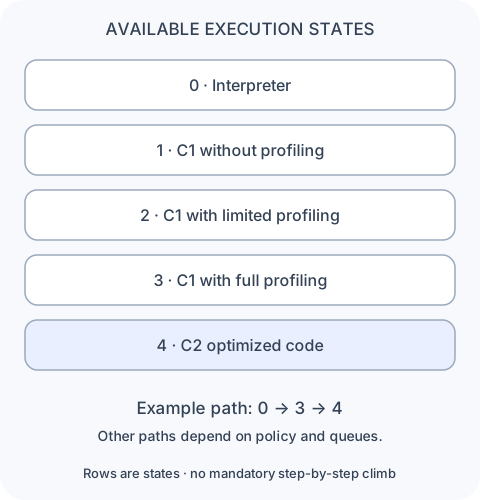
Here is what each level means in the configuration used by this lesson:
| Level | How the method runs | What HotSpot records |
|---|---|---|
| 0 | Interpreter | Runtime activity gathered during interpretation |
| 1 | C1 native code | No profiling instrumentation |
| 2 | C1 native code | Limited profiling, mainly call and loop activity |
| 3 | C1 native code | Fuller profiling, including branch and receiver behavior |
| 4 | C2 native code | Uses the collected evidence for deeper optimization |
Profiling instrumentation means extra generated instructions that update counters or record observations while the application runs. The program still performs its normal work; HotSpot gathers a compact summary alongside it.
The level names come from HotSpot’s compilation-level definitions.
Our process method might follow 0 → 3 → 4: first the interpreter, then C1 code that gathers a full profile, then C2 code. But that is only one possible route. A method can stay at level 0, use level 1 when profiling is unnecessary, or move through level 2 while the C2 compiler is busy.
HotSpot’s compilation policy chooses among these states. It considers how active the code is, what has already been learned, properties of the method, and whether compiler threads are available. A counter reaching a threshold can make a method eligible for compilation. The compiled code still has to wait for a compiler and be generated before the application can use it.
The details are visible in HotSpot’s compilation policy. The beginner-friendly rule is: the levels are options controlled by policy, not a mandatory staircase.
C1 can run the method and keep learning
HotSpot does not need to keep process in the slower interpreter just to gather a better profile. At level 2 or 3, C1 generates native instructions for the method and includes profiling instrumentation. When an application thread runs that C1 code, it performs the method’s work and updates HotSpot’s observations.
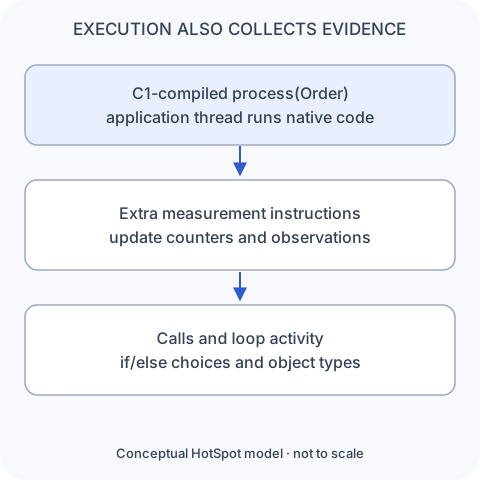
Some counters reveal how often the method is called or a loop repeats. A richer profile can also record which side of an if statement is usually taken and which concrete object type appears at a particular method call. HotSpot therefore learns about behavior at specific places inside process, not just whether the whole method is popular.
Those extra measurements have a cost, which is why C1 has different profiling levels. The key point is that compiled does not mean finished learning. HotSpot can execute faster native code and still collect evidence for a later C2 compilation. Oracle’s tiered-compilation documentation describes this combination.
C2 uses the profile to optimize the common case
Now give process a real call site:
void process(Order order) {
    pricingService.price(order);
}
The field or parameter may be declared as the PricingService interface, so several implementations are legal. At runtime, however, the profile at this exact call site might show the following illustrative result:
99.9%  DefaultPricingService
 0.1%  another PricingService implementation
Java still permits several receiver types. The profile only says that one concrete type has dominated so far.
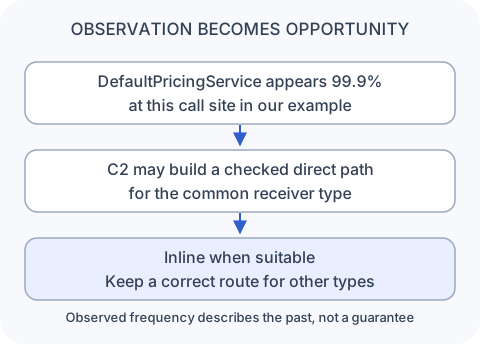
C2 may use that evidence to make the common path more direct. Normally, an interface or virtual call must choose the correct implementation from the receiver object. Devirtualization means that the compiler turns this general call into a direct target when it has enough evidence and a way to remain correct if the evidence stops matching reality.
Once the target is clear, C2 may inline it: copy the useful operations from DefaultPricingService.price into the compiled form of process instead of making a separate call. C2’s call optimization implementation combines profile information with many other constraints. The illustrative 99.9% is not a universal threshold that forces inlining.
The optimized code still has to preserve Java’s behavior if another legal implementation arrives. HotSpot can protect the common path with a type check and use a fallback path or leave the optimized code through deoptimization. We will study that recovery process in the next lesson.
A profile describes the past; it does not guarantee the future. Also, not every direct call depends on a runtime guess. Sometimes class relationships alone prove that only one target is possible.
Inlining reveals more optimization opportunities
Take a small calculation in the same order-processing path:
int total(Order order) {
    return order.price() + order.tax();
}
Without inlining, the compiler sees total calling two other methods. With inlining, it can see the operations inside price() and tax() together with the addition in total.
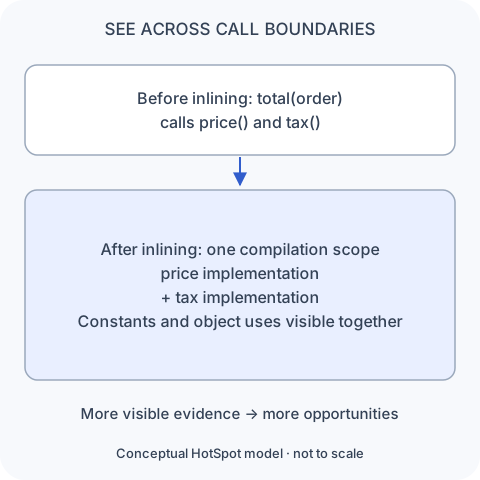
That wider view matters more than the saved call instruction. The compiler may discover that a value is constant, that a calculation is repeated unnecessarily, or that a branch can never be taken on the optimized path.
Inlining can also reveal the whole lifetime of a temporary object created inside a helper method. Escape analysis may then prove that the object never becomes visible outside the compiled group of methods. Scalar replacement can keep the needed field values directly and remove the allocation when its other requirements are met.
This reconnects to Lesson 9: escape analysis and scalar replacement. Inlining exposes evidence; it does not guarantee that an allocation disappears. Allocation elimination also does not mean HotSpot moves every non-escaping object onto the thread stack.
Inlining has its own cost. A larger compiled body takes more time to analyze and can produce more machine code. HotSpot therefore uses limits and budgets rather than inlining every call it can identify.
The same method can change form while the JVM runs
At this point, process still has one Java definition and one bytecode representation, but HotSpot may have created several ways to execute it over time:
bytecode through the interpreter
C1-compiled native code
C2-compiled native code
This does not create three Java methods. It creates different executable forms for the same method. HotSpot often calls one installed compiled version an nmethod. The name is useful when reading VM logs or source code, but its internal layout is not needed here.
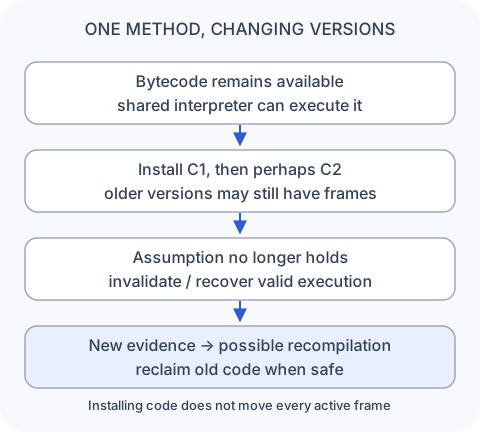
When HotSpot installs a newer version, later calls can enter that version. A call already running inside an older version does not automatically jump to the new entry point, and its stack frame may still need the old code. HotSpot therefore cannot always reclaim an older version immediately.
Lesson 13 introduced the special case of a long-running loop. On-Stack Replacement, or OSR, can transfer that active invocation into compiled loop code at a suitable entry point. Ordinary installation and OSR are related, but they are not the same event.
A compiled version may later depend on an assumption that stops being true. HotSpot can stop using that version for new calls, recover a valid execution state, and compile again using newer evidence.
Keep these events separate:
install newer code
invalidate code whose assumption failed
recompile using new evidence
reclaim old code when it is safe
They can happen at different times. Throughout the lifecycle, the behavior defined by the Java program remains the contract.
Why every method does not go straight to C2
Imagine that an application touches 50,000 methods during startup, but only 500 continue running often after startup. These numbers are a thought experiment, not a measurement. If C2 deeply optimized all 50,000, most of that compiler work would target code that soon becomes inactive.
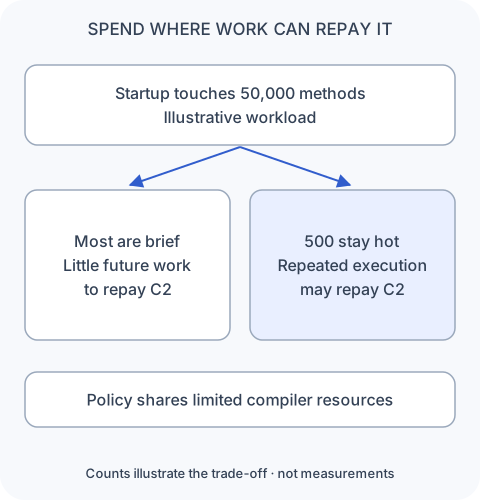
Compilation pays for itself only when enough future executions benefit from the faster code. A startup helper may finish all of its work before C2 completes. A hot request handler may use the optimized result for hours. HotSpot cannot know the future, so it uses current activity as evidence about where deeper optimization is likely to pay back its cost.
Aggressive compilation uses CPU and temporary compiler memory, creates more native code, and can make other methods wait longer for a compiler. A lighter tier can therefore be the better choice even when a C2 version of that one method would run faster. HotSpot is managing the performance of the whole application with finite resources.
Compilation happens in the background
Suppose the compilation policy decides that process deserves a C2 version. That decision does not make the optimized code appear immediately.
With normal background compilation, HotSpot adds a compilation request to a queue. Dedicated compiler threads take requests from the C1 and C2 queues and do the compilation work. Meanwhile, application threads can keep using the interpreter or an already installed compiled version. When the new code is ready, HotSpot installs it so later execution can use it.
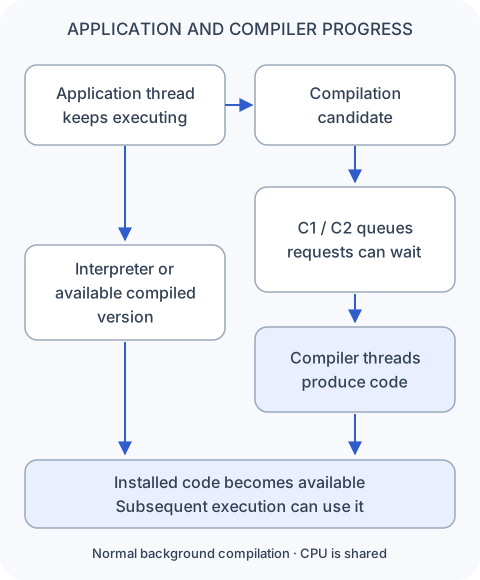
This gives us four separate moments:
method becomes eligible
        ↓
request waits in a compiler queue
        ↓
compiler thread produces native code
        ↓
HotSpot installs the result
If many methods become hot at once, requests can arrive faster than compiler threads finish them. A method may therefore be hot enough for C2 while still running in C1 because its C2 request is waiting or being compiled. Queue pressure can also influence which tier the policy chooses next.
Background compilation is concurrent, but it is not free. Compiler threads share the machine’s CPU with application threads, garbage collection, and other runtime work. During warm-up, high process CPU may partly come from the JIT compilers rather than request handlers. If the machine is CPU constrained, application work and the compilation intended to speed up later work can both slow down.
This is why total CPU alone does not explain a warm service. Look at compiler activity together with latency and throughput. Background compilation is the normal model here, although JVM configuration can change the details.
Compiled machine code lives in the Code Cache
C1 and C2 produce native machine code, so HotSpot needs executable memory in which to store it. That region is the Code Cache.
The Code Cache is part of the JVM process’s native memory. It is separate from the Java heap, where ordinary Java objects live, and from Metaspace, where HotSpot keeps class metadata.
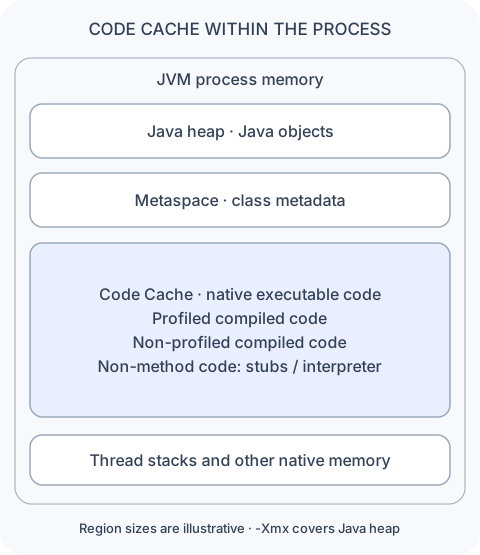
Some diagnostics call a section of the Code Cache a code heap. That is an unfortunate name for a beginner because it is not the Java object heap. -Xmx controls the maximum Java heap size; it does not directly enlarge the Code Cache or limit the memory of the whole JVM process.
JIT compilation also needs temporary compiler data and compiler-thread stacks. Those use native memory in addition to the installed machine code.
When the segmented Code Cache is enabled, HotSpot divides the space into three broad areas:
- Profiled code: compiled methods that still gather profiles, commonly C1 level 2 or 3 code.
- Non-profiled code: compiled methods without profiling instrumentation, including C2 code and C1 level 1 code.
- Non-method code: VM machinery such as runtime stubs and interpreter code.
This separation helps HotSpot manage code with different purposes and lifetimes. “Non-profiled” does not mean “C2 only,” because level 1 C1 code also runs without profiling instrumentation. Exact sizes and enabling conditions depend on configuration; a later lesson will focus on Code Cache diagnostics.
Several compiled versions of a method can exist at the same time, so recompilation can temporarily increase Code Cache use. Old code can eventually be reclaimed when it is no longer needed; the cache does not have to grow forever.
Code Cache reports may distinguish memory that is used, committed, reserved, or actually resident in physical memory. Those terms are not interchangeable. If HotSpot runs out of usable Code Cache space, further compilation can be restricted even while the Java heap looks healthy.
Warm-up does not move the whole JVM through one pipeline
A JVM does not have one global setting that changes from “interpreter mode” to “C1 mode” to “C2 mode.” Each method follows its own path. At the same moment:
rarely used method      → interpreter
moderately active method → C1
very hot method          → C2
Compilation and application execution also overlap. This per-method adaptation is what makes warm-up gradual.
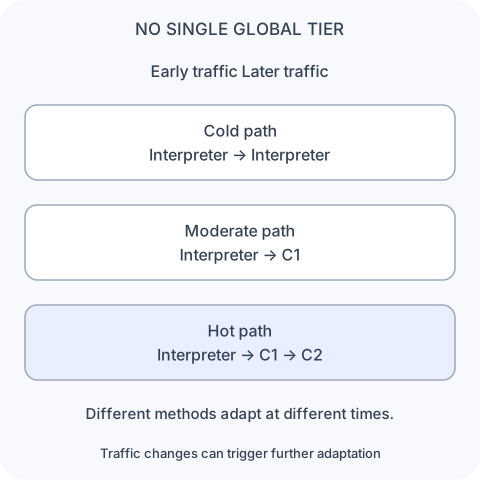
After a deployment or autoscaling event, a fresh instance may serve the same request using more interpreted or C1 code than an established instance. Passing a readiness check only means the instance is ready to receive traffic; it does not prove that important request paths have accumulated profiles and C2 code.
Warm-up requires representative execution. Waiting quietly for two minutes does not warm code that never runs during those two minutes.
When new instances join a fleet, observe early-request latency, sustained throughput, CPU, and native memory. Do not attribute every early slowdown to the JIT: class loading, class initialization, application caches, garbage collection, and external services also affect startup behavior. A later traffic shift can expose new methods or receiver types and trigger more compilation in a process that already seemed warm.
Benchmarking begins with the question you want to answer. If you care about cold start, the interpreter, C1, and compiler work are part of the result. If you care about sustained execution, a brief run can be misleading because it mixes those phases with C2 execution.
A steady-state benchmark needs representative inputs, results that cannot be optimized away, repeated measurements, and evidence that behavior has stabilized. A fixed warm-up duration alone does not prove that the important code has reached a particular tier. The diagrams in this lesson show concepts, not measured timing curves.
Check your reasoning
Method A runs 100 times during startup and then is never called again. Method B continues running for hours. Why might immediate C2 compilation of both waste work? Would your answer change if Method A’s single call contained a loop with millions of iterations?
Pause here, then check your reasoning
C2 compilation uses CPU and memory now, so future executions must save enough work to repay that cost. Method B offers more opportunity under the original assumptions. The large loop changes the evidence: one invocation can still contain a great deal of repeated work. Back-edge activity can make that loop a compilation candidate, and OSR can move the active invocation into compiled loop code. HotSpot is estimating from evidence; it does not know the future.
A compilation log shows process at level 2 before level 3. Is the JVM malfunctioning? While a compiler thread is producing its C2 version, must application calls to process stop?
Check the tier and queue model
No. Level 2 is a valid C1 state with limited profiling, and policy or queue conditions can make it useful. Under normal background compilation, application calls continue through the interpreter or an installed compiled version. Becoming eligible, waiting in a queue, compiling, and installing the result are separate events.
A profile reports 99.9% DefaultPricingService receivers. Can C2 return an incorrect result when another legal implementation arrives? If generated machine code consumes more memory, should that increase Java heap occupancy?
Check correctness and memory boundaries
No to both. Optimized specialization must preserve Java behavior through checks and a correct fallback or recovery path. Generated code lives in the Code Cache, outside the Java object heap. Compiler data and compiler-thread stacks can use additional native memory as well.
From tiered compilation to deoptimization
We can now follow one method from start to finish. process begins as bytecode executed by the interpreter. Its activity makes it a compilation candidate. C1 can turn it into native code while continuing to build a useful profile. Policy may later request C2, a compiler thread does the work, and HotSpot installs the optimized result in the Code Cache.
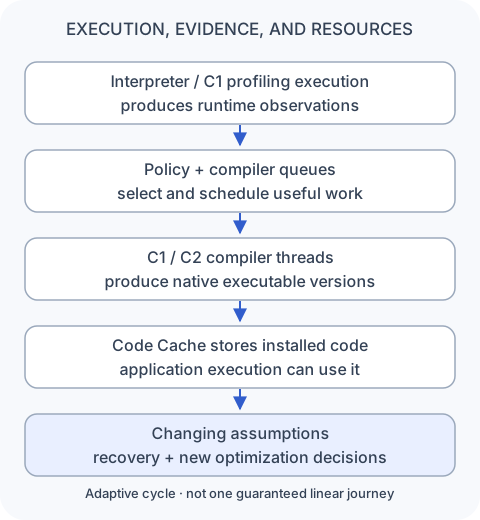
The method did not become a different Java method. HotSpot changed how it executes that method as the expected benefit and available evidence changed.
This is the central model to carry forward:
HotSpot spends optimization effort gradually, using runtime evidence to decide where more compilation work is likely to pay off.
Some C2 optimizations depend on assumptions about future behavior. Those assumptions can become outdated while the application is running. The next lesson, speculative optimization and deoptimization, follows the checks that protect correctness and how HotSpot recovers when an assumption stops holding.
Sources and implementation boundaries
Adapted from Daily JVM Byte #14 and the retrieved reviewed draft. Examples, counts, and diagrams are illustrative, not executed benchmarks. JDK 25 HotSpot with C1/C2 anchors the implementation details; compilation choices depend on configuration and workload.