You have a method whose bytecode is ready to run:
iload_1
iload_2
iadd
ireturn
The CPU cannot execute these JVM instructions directly. It executes the machine instructions of your particular processor. So what reads iload_1, performs its work, and moves to iload_2?
One answer in HotSpot is the interpreter: JVM machinery that takes one bytecode instruction at a time and performs what that instruction means. A first mental model is a loop:
while the method has not returned:
    read the current bytecode
    execute what that bytecode means
    choose the next bytecode
We will build that loop carefully. Before we do, we need one idea that explains why JVM instructions look the way they do.
The JVM is a stack machine
A CPU instruction often names registers that hold its inputs. JVM bytecode usually works differently. Most JVM instructions take their inputs from an operand stack and put their result back on that stack. A machine designed around this rule is called a stack machine.
This operand stack belongs to the current method invocation’s frame. It is separate from the thread’s stack of method calls. The words are similar, so keep the two levels apart:
thread call stack
└── current method frame
    ├── local-variable slots
    └── operand stack  ← bytecodes work here
Suppose add(10, 20) is running. The arguments are already in local slots 1 and 2. The bytecode does not say add slot 1 to slot 2. Instead, load instructions copy the two values onto the operand stack, and iadd consumes the values at the top.
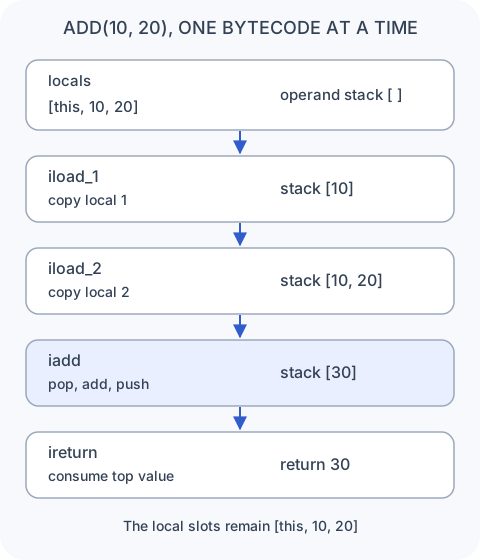
Follow the state after each instruction. The rightmost value is the top of the operand stack:
locals: [this, 10, 20]

instruction    stack afterward
iload_1        [10]
iload_2        [10, 20] ← top
iadd           [30]
ireturn        []
                return 30 to caller
iload_1 means “copy the integer in local slot 1 onto the operand stack.” iadd means “take the top two integers, add them, and put the result on the stack.” ireturn takes the integer at the top and returns it to the caller. The local slots still contain 10 and 20 throughout this sequence.
This is the logical contract defined by the JVM specification. HotSpot is free to keep the top value in a CPU register or use another efficient physical representation, provided that the program behaves as this stack-machine model requires.
Build a tiny interpreter loop
Now imagine implementing a teaching version of an interpreter. Each frame needs a bytecode position, usually called the program counter or pc, that identifies the instruction being executed. It also needs the local slots and operand stack from the previous section.
The following pseudocode is deliberately simpler than HotSpot, but it exposes the core mechanism:
pc = 0

while true:
    opcode = bytecode[pc]

    if opcode == ILOAD_1:
        operandStack.push(locals[1])
        pc = pc + 1

    else if opcode == ILOAD_2:
        operandStack.push(locals[2])
        pc = pc + 1

    else if opcode == IADD:
        right = operandStack.pop()
        left  = operandStack.pop()
        operandStack.push(left + right)
        pc = pc + 1

    else if opcode == IRETURN:
        return operandStack.pop()
Every trip around the loop has three jobs: fetch the current opcode, dispatch to the code that implements it, and continue at the next bytecode position. Dispatch just means selecting the matching implementation. In the pseudocode, the if chain performs dispatch.
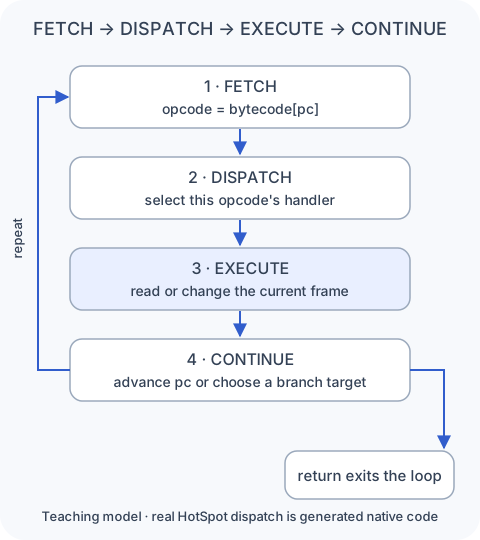
For add(10, 20), the loop runs four times:
pc 0 → iload_1 → stack [10]     → pc 1
pc 1 → iload_2 → stack [10,20]  → pc 2
pc 2 → iadd    → stack [30]     → pc 3
pc 3 → ireturn → return 30
The next bytecode is not always pc + 1. A conditional branch may jump elsewhere. A loop’s backward branch moves the position to an earlier instruction. A method call creates a callee frame and begins executing its bytecodes; when the callee returns, the caller resumes. The loop above omits those cases so the essential cycle stays visible.
The JVMS instruction set defines what each opcode must do. HotSpot supplies the machinery that performs those rules.
HotSpot replaces the pseudocode branches with native handlers
Our teaching loop uses if opcode == .... HotSpot uses a faster, implementation-specific form of dispatch. During JVM initialization, its template interpreter generator creates native machine-code handlers for bytecode operations on the current CPU architecture.
Think of a template as a recipe HotSpot uses to generate a reusable handler:
template for iadd
    ↓ JVM starts on this CPU
native iadd handler is generated
    ↓ method later reaches iadd
interpreter dispatches to that handler
    ↓
handler performs iadd and dispatches onward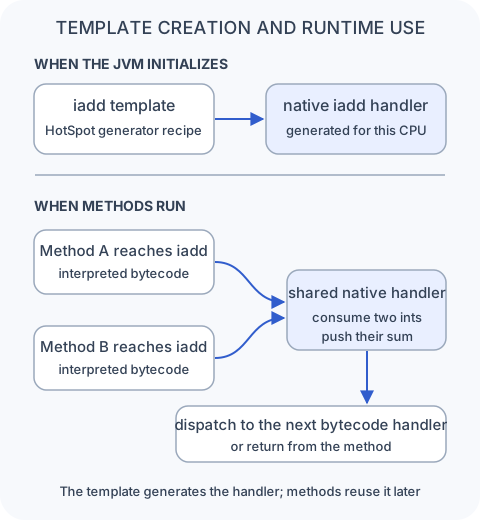
This clears up a common misconception: the interpreter is not Java code slowly interpreting Java code. The CPU is always executing native instructions. During interpreted execution, those instructions belong to shared interpreter handlers. After JIT compilation, the CPU executes native code generated specifically for a method and possibly its inlined callees.
The JDK 25 template generator installs bytecode entry points, while CPU-specific files such as the x86 template table generate the underlying operations. These names describe HotSpot’s implementation; another conforming JVM can implement the JVMS rules differently.
Why execute this way before compiling?
At startup, an application may touch thousands of methods. Some run once to parse configuration. Others later execute millions of times. HotSpot does not yet know which is which.
Compiling and optimizing a method costs CPU time, compiler-thread work, temporary native memory, and space in the Code Cache for the generated machine code. If a method runs once, compilation can cost more than the execution it saves.
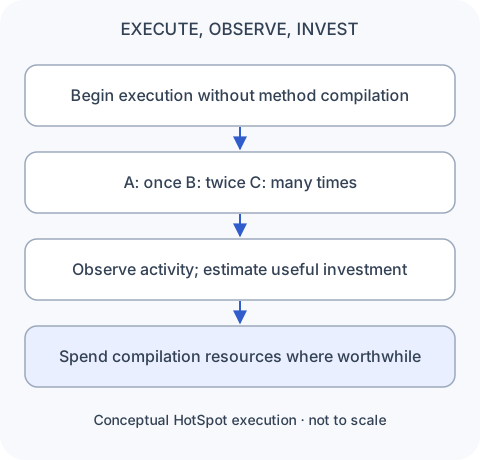
The interpreter gives HotSpot a practical starting strategy:
execute now
observe what the application
actually does
compile when the likely saving
can repay the cost
“Execute now” means that HotSpot need not wait for a method-specific optimized compilation. Class loading, verification, and initialization can still contribute to startup time.
Running code leaves useful evidence
While the application runs, HotSpot can record profiles: summaries of behavior seen at particular methods and bytecode locations. A profile is runtime evidence, not a prediction that the future must look the same.
Suppose this method is called repeatedly:
int size(List<?> values) {
    return values.size();
}
The declared type is List, so several implementations are legal. An illustrative profile at this call site might record:
10,000 calls to values.size()
9,800 receivers were ArrayList
  200 receivers were LinkedList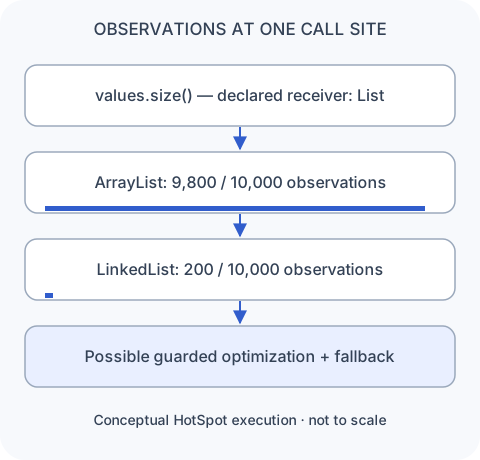
Later, a compiler can use that evidence to make the common ArrayList path faster while retaining a correct route for LinkedList or a new receiver type. Other profiles can summarize which branch is usually taken, how often a method is called, and how often a loop repeats.
Profiling is not limited to the interpreter. HotSpot’s lower compiled tiers can run a method while continuing to collect information for later optimization. The next lesson will make those tiers concrete.
Hotness means repeated work
HotSpot uses activity such as method invocations and loop iterations as evidence that code is hot. Hot code is code running often enough that compilation may pay off.
A counter is a helpful first model:
method is called
    ↓
invocation activity increases
    ↓
enough repeated work is observed
    ↓
method becomes a compilation candidate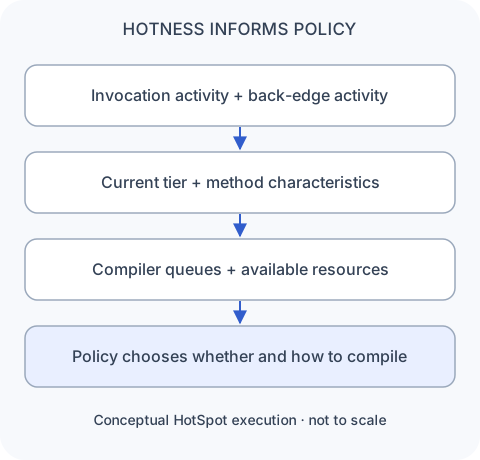
Real policy is more nuanced than counter == magicNumber. It also considers the current execution tier, method characteristics, compiler queues, and available resources. A compilation request takes time to process, so becoming a candidate does not instantly replace the running code.
One invocation can still contain a hot loop
Invocation count alone misses an important case:
void process() {
    for (int i = 0; i < 100_000_000; i++) {
        work(i);
    }
}
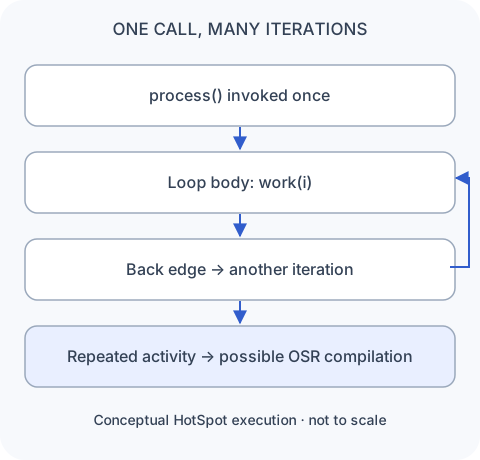
process() might be called only once, but the loop body can run a hundred million times. At the bytecode level, the end of the loop branches back to an earlier bytecode position. That jump is a back edge.
enter process() once
    ↓
execute loop body
    ↓
branch backward to loop test  ← back edge
    ↓
repeat
Repeated back-edge activity tells HotSpot that the loop is hot even though the method has only one invocation.
OSR moves a running loop into compiled code
Suppose HotSpot compiles the hot loop while process() is still on iteration 40,000. Waiting for the method to return would waste the new code because this invocation may run for a long time. On-Stack Replacement, or OSR, lets HotSpot continue the active invocation in compiled code.
The important problem is state transfer. At the handoff point, the interpreter already has live values such as the current i, method arguments, references, and the current bytecode position. Compiled execution must receive an equivalent logical state.
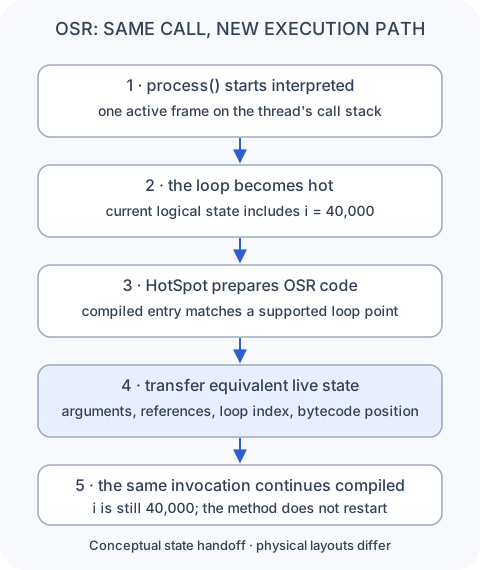
Conceptually:
interpreted process()
current i = 40,000
        ↓ loop judged hot
compile an OSR entry
for this loop
        ↓ when the compiled code is ready
map the current logical state
into the compiled layout
        ↓
same invocation continues compiled
current i = 40,000
“On-stack” means that the method is already active in the thread’s call stack. “Replacement” means its execution moves from the interpreted representation into compiled execution at a supported point. OSR does not mean that arbitrary machine instructions can switch at any instant, and it does not begin a second Java call.
Compiled execution avoids repeated bytecode dispatch
The interpreter handles the addition by dispatching four individual bytecodes through reusable handlers. A JIT compiler can look at the method as a larger unit and generate method-specific native code.
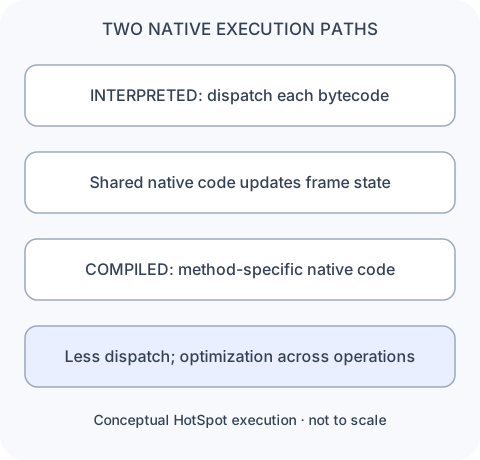
Avoiding dispatch is only the first advantage. The compiler can inline calls, fold constants, remove dead work, optimize loops, and apply escape analysis. The compiled result may bear little one-to-one resemblance to the original bytecodes. Both paths still execute native CPU instructions; they differ in reuse, specialization, and optimization.
Warm-up is adaptation becoming visible
As an application starts, some code runs through the interpreter or lower compiled tiers. Profiles accumulate. Compilation finishes for useful hot paths. Later requests can therefore execute through different native code from earlier requests in the same process.
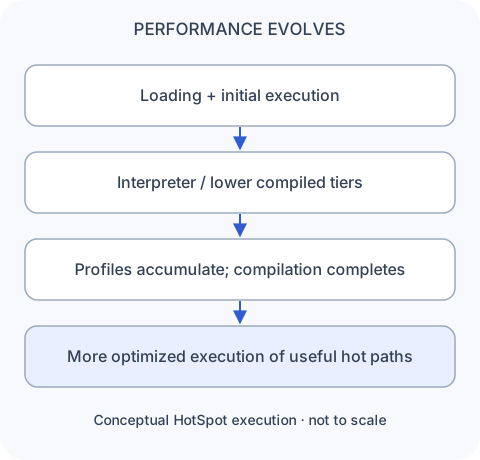
This is the course theme in a concrete form: execution changes while the application runs.
Warm-up matters when the lifetime or traffic pattern gives the JVM little time to adapt:
- A short CLI program may finish before deeper optimization repays its cost.
- A serverless instance may handle a cold request and disappear, or remain alive long enough to warm.
- A new autoscaled replica may initially have different latency and throughput from an older replica.
- Immediately after deployment, readiness does not guarantee that important request paths have executed enough to warm.
- A benchmark can accidentally mix class loading, interpretation, compiler work, and optimized execution in one number.
There is no universal duration after which a JVM is “warm.” The relevant code must run with representative inputs, and compilation is only one of several influences on early performance. Class initialization, caches, allocation, GC, and external systems also matter.
Check your reasoning
Given this state, what will one interpreter iteration do?
pc points to iadd
operand stack is [10, 20]
locals are [this, 10, 20]
Pause here, then check your reasoning
The interpreter dispatches to the iadd implementation. It consumes 20 and 10, adds them, and leaves 30 on the operand stack. The local slots remain unchanged. Execution then continues at the next bytecode position.
Now suppose process() was called once and is still inside a very long loop when OSR code becomes ready. Does OSR call process() again from the beginning?
Check the OSR handoff
No. OSR transfers an equivalent version of the active invocation's logical state into compiled execution at a supported loop entry. The method remains the same invocation, and live state such as the current loop index is preserved.
From one interpreter loop to tiered compilation
We can now assemble the model without skipping a link:
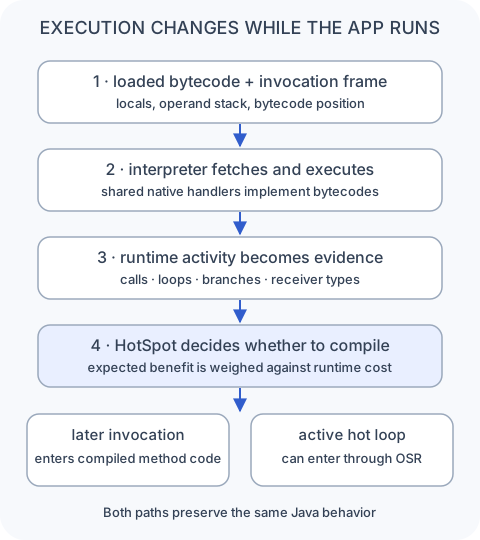
The next tiered compilation lesson follows how HotSpot uses C1, C2, and several compilation levels to trade compilation speed, profiling, and generated-code quality. It can compile the same method more than once because its evidence and optimization budget change while the application runs.
Sources and implementation boundaries
Adapted from Daily JVM Byte #13 and the available reviewed draft. Counts, costs, and pseudocode are explanatory rather than measurements or literal HotSpot source. The large loop was not run. JDK 25 sources anchor HotSpot implementation claims; the JVMS defines behavior rather than a required interpreter or compilation policy.