You can now read invokevirtual #17 and explain how its constant-pool entry identifies a method. But the instruction still needs an actual receiver and arguments. Where are those values while the method executes?
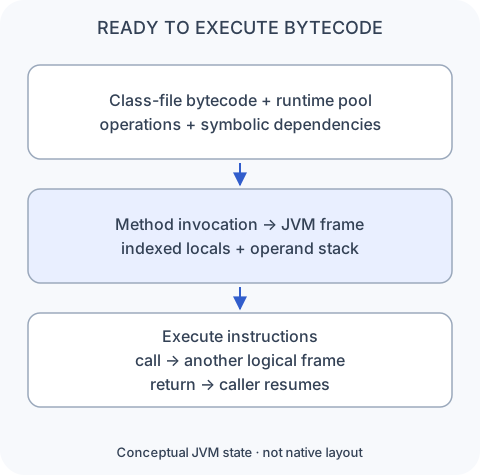
Lesson 11 connected symbolic references to runtime entities. This lesson follows the working state that makes those entities useful. Each method invocation gets its own JVM frame, containing a local-variable array, an operand stack, and a reference to the runtime constant pool of the class containing the current method.
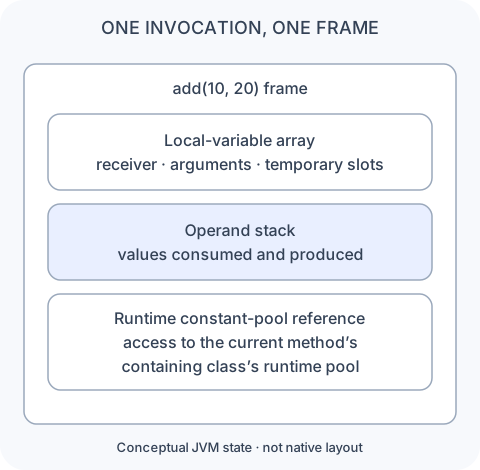
The method definition can serve many invocations. Each invocation has separate execution state, even when recursion invokes the same method again before the first invocation finishes. A frame is discarded when its invocation completes, normally or exceptionally. These are JVM execution semantics; we will distinguish them from physical machine frames before the end of the lesson.
Why the JVM is called a stack machine
Before following loads and stores, name the execution model they belong to. JVM bytecode describes a stack machine: most instructions receive inputs from a last-in, first-out operand stack and leave results on that same stack. The top value is the next one an instruction consumes.
This is different from an instruction that names all of its inputs directly. An imaginary register-style addition might say add r1, r2. JVM iadd does not name local slots or CPU registers. It means: take the top two integer values from the current frame’s operand stack, add them, and push the result.
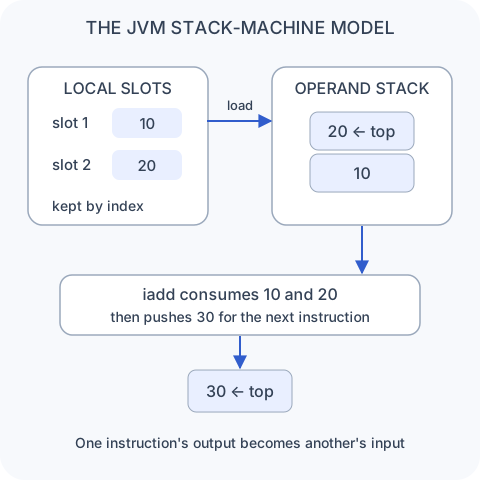
The operand stack belongs to one method frame. It is not the thread’s call stack, which contains the frames of nested method invocations. We will use “operand stack” and “call stack” explicitly whenever both are in view.
Local variables are indexed JVM slots
We will use one instance method throughout the walkthrough:
int add(int a, int b) {
    int result = a + b;
    return result;
}
For add(10, 20), slot 0 holds the receiver reference, this. Slots 1 and 2 receive the integer arguments. Our compiled example uses slot 3 for the result once the addition has happened. Before that store, slot 3 does not contain an initialized result that bytecode is allowed to read.
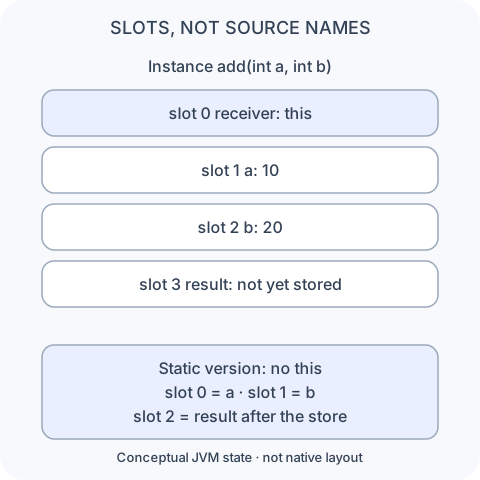
iload_1 reads an integer from slot 1; istore_3 writes an integer into slot 3. aload_0 loads a reference from slot 0, which is the receiver in this instance method. The instructions address indexes, not the names a, b, or result. Optional debugging metadata can associate source names with slots over particular bytecode ranges, but execution does not require those names.
A static method has no receiver and no this. Its parameters begin at slot 0. If our method were static with the same body, a and b would occupy slots 0 and 1, and this compilation could use slot 2 for result.
Do not give each source variable a permanent box in your mental model. A compiler can reuse a local slot for variables with non-overlapping lifetimes. Conversely, the historical two-slot convention for long and double still applies in the current JVMS: each occupies two consecutive local-variable slots. This is a logical storage convention, not a claim about two physical CPU registers or a fixed native frame layout. See JVMS 2.6.1.
Follow the operand stack through addition
The local-variable array keeps values available by index. The operand stack holds values that instructions consume and produce. Each frame has its own operand stack; it is not the thread’s overall stack of method calls.
For the assignment int result = a + b, follow these four instructions. We write stacks from bottom to top, so the rightmost value is the top.
iload_1
iload_2
iadd
istore_3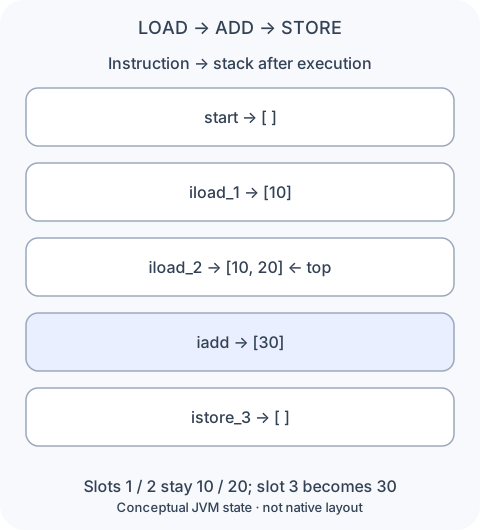
iload_1: Copy 10 from local slot 1 onto the empty operand stack. The stack becomes[10]; slot 1 still contains 10.iload_2: Copy 20 from slot 2 onto the stack. It becomes[10, 20].iadd: Pop the two integers, add them, and push 30. The stack becomes[30]. The original local slots are unchanged.istore_3: Pop 30 and store it into slot 3. The stack is empty again, and slot 3 now contains the result.
iadd does not encode “add local slot 1 to local slot 2.” Its inputs come from the operand stack. That is why the two loads are necessary in this bytecode sequence. The final return result then uses iload_3 to put 30 back on the stack and ireturn to return it.
This model extends beyond arithmetic. iconst_1 pushes an integer constant. A getfield instruction consumes an object reference and pushes the selected field’s value. Loads, stores, field accesses, and calls compose because their stack inputs and outputs fit together. The individual instruction contracts are defined in JVMS 6.
Symbols identify the member; operands supply the values
Suppose a caller evaluates customer.getName(). An illustrative sequence is:
aload_1
invokevirtual #17
astore_2
The constant-pool entry at #17 identifies the referenced method through its class, name, and descriptor. The receiver reference loaded from local slot 1 supplies the actual customer object. These answer different parts of the operation: what member or type is involved, and what runtime values are involved? As Lesson 11 explained, virtual method selection can also depend on that receiver’s runtime class.
For our running example, an instance invocation consumes a receiver and two integer arguments from the caller’s operand stack. Those values initialize the callee’s local slots; the callee begins with an empty operand stack. Older values underneath the invocation operands remain in the caller’s stack.
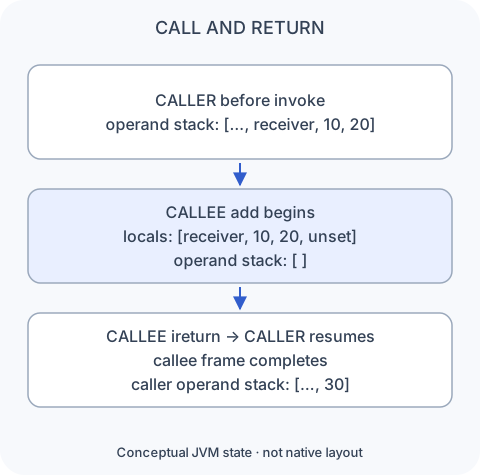
When add executes ireturn, its result is transferred to the invoking frame’s operand stack and the caller resumes. A void return supplies no result. If an exception escapes the invocation, completion is abrupt rather than a normal value return. The JVM looks for an applicable handler, unwinding frames as necessary; a selected handler begins with the exception reference on its operand stack. See JVMS invocation and return instructions.
Why use a stack machine for bytecode?
Because the operands are usually implicit, bytecode can describe the same logical work without choosing the physical registers of a particular CPU. Instructions such as iadd are compact, and the verifier can reason about types and stack shapes along control-flow paths.
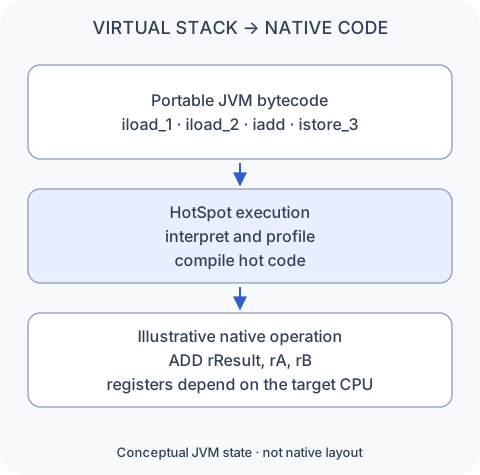
A stack machine is one way to build a portable intermediate representation; register-based virtual machines can also be portable. Portability does not require a stack. The useful distinction here is that JVM bytecode is not the final native instruction stream.
HotSpot can interpret bytecode, collect execution profiles, and compile hot code into machine instructions for the current processor. The JIT may keep values in registers, fold operations into constants, or remove computations entirely. A sequence of bytecode loads and stores therefore does not imply the same number of hardware memory accesses. The register instruction in the diagram is pseudocode, not a prediction of a particular CPU’s disassembly.
Inspect max_locals and max_stack yourself
A method with bytecode has a class-file Code attribute that declares max_locals and max_stack. For our instance add method, four local slots are sufficient, and the maximum operand-stack depth is two units, reached just after iload_2.
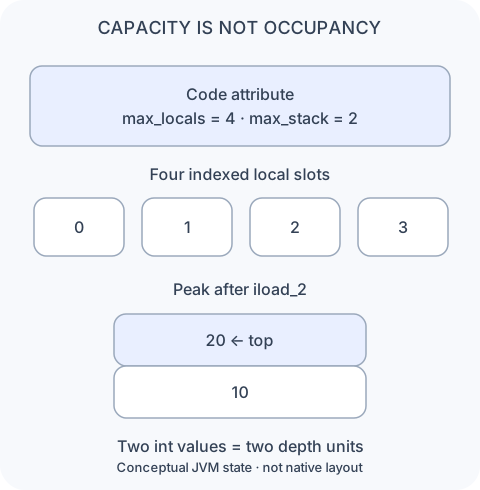
These are capacities for the bytecode execution model, not the current occupancy and not native frame sizes in bytes. An operand-stack long or double contributes two depth units, while an int or reference contributes one. The declaration must cover every valid execution path, not only the path used in a single run. Verification checks the instruction types and stack behavior against class-file constraints. See the Code attribute and bytecode verification.
To see the declaration, save this small standalone example as FrameDemo.java in a scratch directory:
public class FrameDemo {
    int add(int a, int b) {
        int result = a + b;
        return result;
    }

    public static void main(
            String[] args) {
        int sum = new FrameDemo()
            .add(10, 20);
        System.out.println(sum);
    }
}
Compile, run, and inspect it:
javac -g FrameDemo.java
java FrameDemo
javap -c -v FrameDemo
Verified with Homebrew OpenJDK HotSpot 25.0.2: the program prints 30, and the relevant disassembly is:
int add(int, int);
  descriptor: (II)I
  flags: (0x0000)
  Code:
    stack=2, locals=4, args_size=3
       0: iload_1
       1: iload_2
       2: iadd
       3: istore_3
       4: iload_3
       5: ireturn
javap displays max_stack as stack and max_locals as locals. Here args_size=3 accounts for the receiver plus two one-slot arguments. It does not mean there are three parameters in the Java declaration. The optional local-variable table supplies familiar names; the bytecode itself still uses indexes.
Nested calls build the thread’s logical stack
Imagine a() calls b(), and b() calls c(). While c() runs, the caller frames remain suspended. Each retains its own locals and operand stack so its execution can resume after its callee returns.
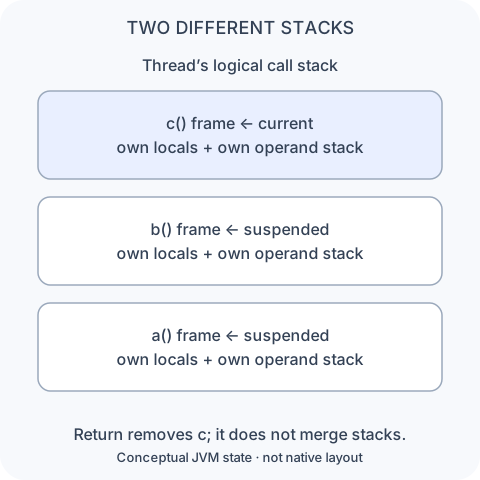
There are two nested structures: the thread’s call stack contains frames, and each frame contains an operand stack. Pushing an integer onto an operand stack does not invoke a method or create a frame. Calling a method creates another logical frame rather than giving the caller a larger operand stack.
When c() completes, its frame disappears and b() becomes current again. A stack trace records an invocation chain at a particular point; it is not a history of every method that has run. Returned calls generally no longer appear in that chain.
Private execution state can reference shared objects
Two threads can execute the same process(customer) method simultaneously. Their local slots and operand stacks are separate. However, their references can point to the very same heap object.
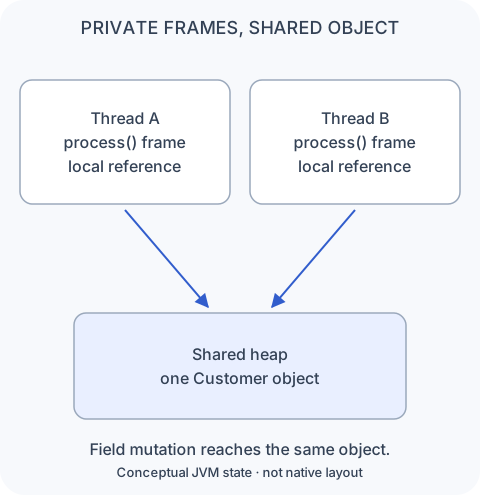
Reassigning one thread’s local reference does not reassign the other thread’s local reference. Mutating a field of the shared object is different: both references lead to that object, so synchronization and visibility rules matter. Thread-confined frame state does not make the referenced object thread-confined.
Frames connect execution to GC roots
In the GC-root lesson, we followed references from roots into the object graph. A live reference held in a frame can be one of those starting points. The reference may occur in locals or temporary operand state; compiled execution may keep it in a register or a stack location.
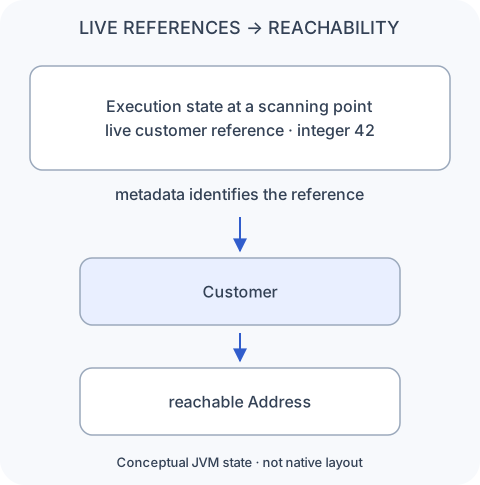
HotSpot must distinguish reference locations from integers and other machine state when scanning roots. Interpreted execution has metadata describing references in its frame representation. Compiled execution uses JIT-generated metadata, including OopMaps at relevant execution points, to locate object references in registers and stack locations.
This is not a promise that a Java variable keeps its object alive until the closing brace of its source scope. Liveness and optimized execution matter; an object with no other retaining path can become collectible after its last relevant use. Likewise, discarding a frame does not immediately collect every object it once referenced. Other roots may still retain them.
HotSpot’s OopMap definitions connect machine locations with reference information. Later lessons on safepoints and OopMaps will explain when and how that information is consumed. For now, connect the two requirements: execute the method correctly, and keep the collector informed about its live references.
Logical JVM frames and compiled machine frames
The frame model tells us what bytecode means. It does not require HotSpot to allocate a literal local array and manipulate a literal operand array for every instruction after JIT compilation.
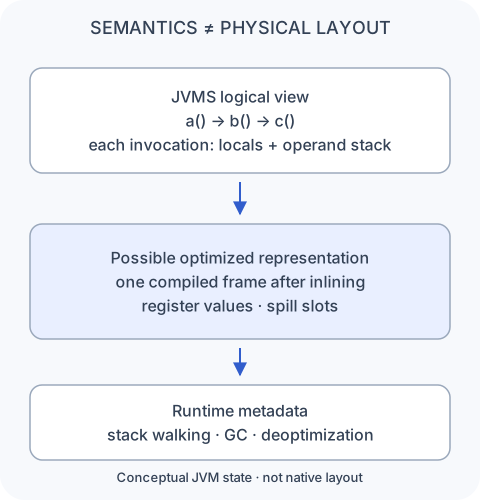
HotSpot interpreter frames map closely to the bytecode model. Compiled frames have a different physical layout: values can reside in registers or spill slots, and some values no longer need storage. Inlining can put several logical Java invocations inside one compiled machine frame. There is no general one-to-one mapping from Java calls to native stack frames.
The runtime retains metadata needed for tasks such as stack walking and deoptimization, which can reconstruct logical Java state when optimized execution must fall back. This continues the distinction from escape analysis and scalar replacement: a semantic object or local value need not have the naive physical representation drawn in a source-level diagram. OpenJDK’s compiled-frame walking implementation exposes these logical views.
Recognize frames in production evidence
Deep recursion keeps creating nested invocations before earlier ones return. If execution requires more stack than is permitted, the JVM throws StackOverflowError. That is different from filling the per-frame operand stack with too many values in valid bytecode.
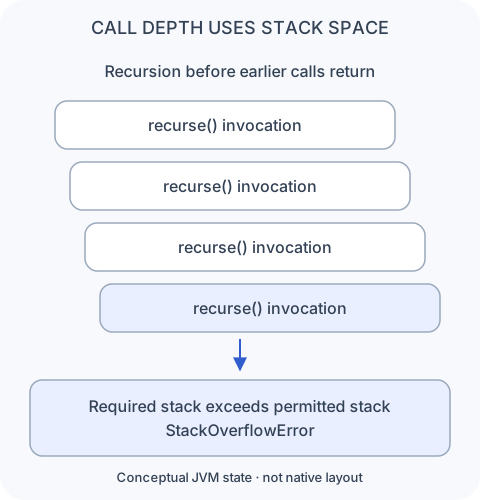
A missing recursion base case is one cause; a legitimate but excessively deep traversal is another. Start by examining the repeated call pattern and the input depth. Increasing stack size can change the limit but does not repair an unbounded recursion. The depth at failure is not a portable constant because physical frame sizes and runtime configuration differ. We do not deliberately exhaust a stack in the example.
Thread dumps show where threads are executing or waiting. Exception traces show the chain associated with the captured failure. JFR events and profilers such as async-profiler can associate observations with stack traces, helping identify costly or frequently sampled call paths. These views expose method chains, not a complete dump of every local slot or operand value. Sampling, inlining reconstruction, configured depth, and missing debugging information affect what you see.
Platform-thread stacks also contribute to aggregate memory use. Virtual threads change the storage and scheduling arrangement: their stacks can be represented in heap stack chunks while unmounted. Keep the logical per-thread frame model without assuming one permanently reserved native stack per virtual thread. We will return to that distinction in the threading material; JEP 444 describes the HotSpot implementation.
Check your reasoning
Pause just after iadd, before istore_3, in add(10, 20). Where is 30? Have slots 1 and 2 changed? Has another method frame been created?
Pause here, then check your reasoning
30 is on the current frame's operand stack. Slots 1 and 2 still hold 10 and 20 because the loads copied their values. Slot 3 has not received the result yet. No new frame was created: these instructions all execute within the same invocation.
Now two threads hold references to the same customer in separate frames. Does that make field updates private? And if a profiler reconstructs three inlined Java calls, must there be three physical machine frames?
Check the ownership and representation boundaries
No to both. Separate local references can point to one shared heap object. Logical Java calls also need not map one-to-one to physical frames after compilation; inlining can combine them while runtime metadata preserves the logical view.
From frame state to the HotSpot interpreter
We can now connect the class file to execution: bytecode specifies operations, the runtime constant pool connects symbolic dependencies, and each invocation supplies frame state for actual values. Instructions transform that state until a call transfers control or a return completes the invocation.
The HotSpot interpreter lesson follows how HotSpot dispatches bytecodes, operates on interpreted frame state, and collects profiling information that helps the JIT choose and optimize hot code.
Sources and implementation boundaries
Adapted from Daily JVM Byte #12 and the available reviewed draft. Diagrams describe logical state, not measured native layouts. The small javap exercise was executed on Homebrew OpenJDK HotSpot 25.0.2. Historical two-slot wording is clarified as a continuing specification rule; max_stack counts depth units, not necessarily the number of values.